
Michigan Consumer Sentiment January Final Falls
The January Final Report came in at 67.2, down 3.4 (4.8%) from the December Final. Investing.com had forecast 68.7. Since its beginning in 1978, consumer sentiment is 21.8 percent below the average reading (arithmetic mean) and 20.9percent below the geometric mean.
Surveys of Consumers chief economist, Richard Curtin, makes the following comments:
Sentiment fell throughout January, posting a cumulative loss of 4.8%, sinking to its lowest level since November 2011. The current slump was due to two sharp declines separated by a brief interlude of rising optimism. The initial steep decline occurred in just two months, a 28.9% plunge in optimism from February to April 2020 due to the shutdown in the economy. Confidence recorded an equally strong recovery beginning in late-2020, rising 23.0% by April 2021. That upturn was reversed during the past nine months, with the Sentiment Index falling by 23.9%. The Delta and Omicron variants were largely responsible, but other factors, some of which were initially triggered by covid, have become independent forces shaping sentiment. While supply chains and essential workers have sparked the initial increases in prices and wages, a wage-price spiral that has subsequently developed is no longer tied to those precipitating conditions. Household spending had been supported by an extraordinary pace of rising home and stock prices that is likely to turn negative in the year ahead. Overall confidence in government economic policies is at its lowest level since 2014, and the major geopolitical risks may add to the pandemic active confrontations with other countries. Although their primary concern is rising inflation and falling real incomes (see the chart), consumers may misinterpret the Fed's policy moves to slow the economy as part of the problem rather than part of the solution. The danger is that consumers may overreact to these tiny nudges, especially given the uncertainties about the coronavirus and other heightened geopolitical risks. Clear policy communication is insufficient if it does not also advance consumers' understanding of the economic tradeoffs involved and their plans to actively alleviate any undue harm. [More...]
See the chart below for a long-term perspective on this widely watched indicator. Recessions and real GDP are included to help us evaluate the correlation between the Michigan Consumer Sentiment Index and the broader economy.

To put today's report into the larger historical context since its beginning in 1978, consumer sentiment is 21.8 percent below the average reading (arithmetic mean) and 20.9 percent above the geometric mean. The current index level is at the 9th percentile of the 529 monthly data points in this series.
Note that this indicator is somewhat volatile, with a 3.0 point absolute average monthly change. The latest data point saw a 3.4 point increase from the previous month. For a visual sense of the volatility, here is a chart with the monthly data and a three-month moving average.

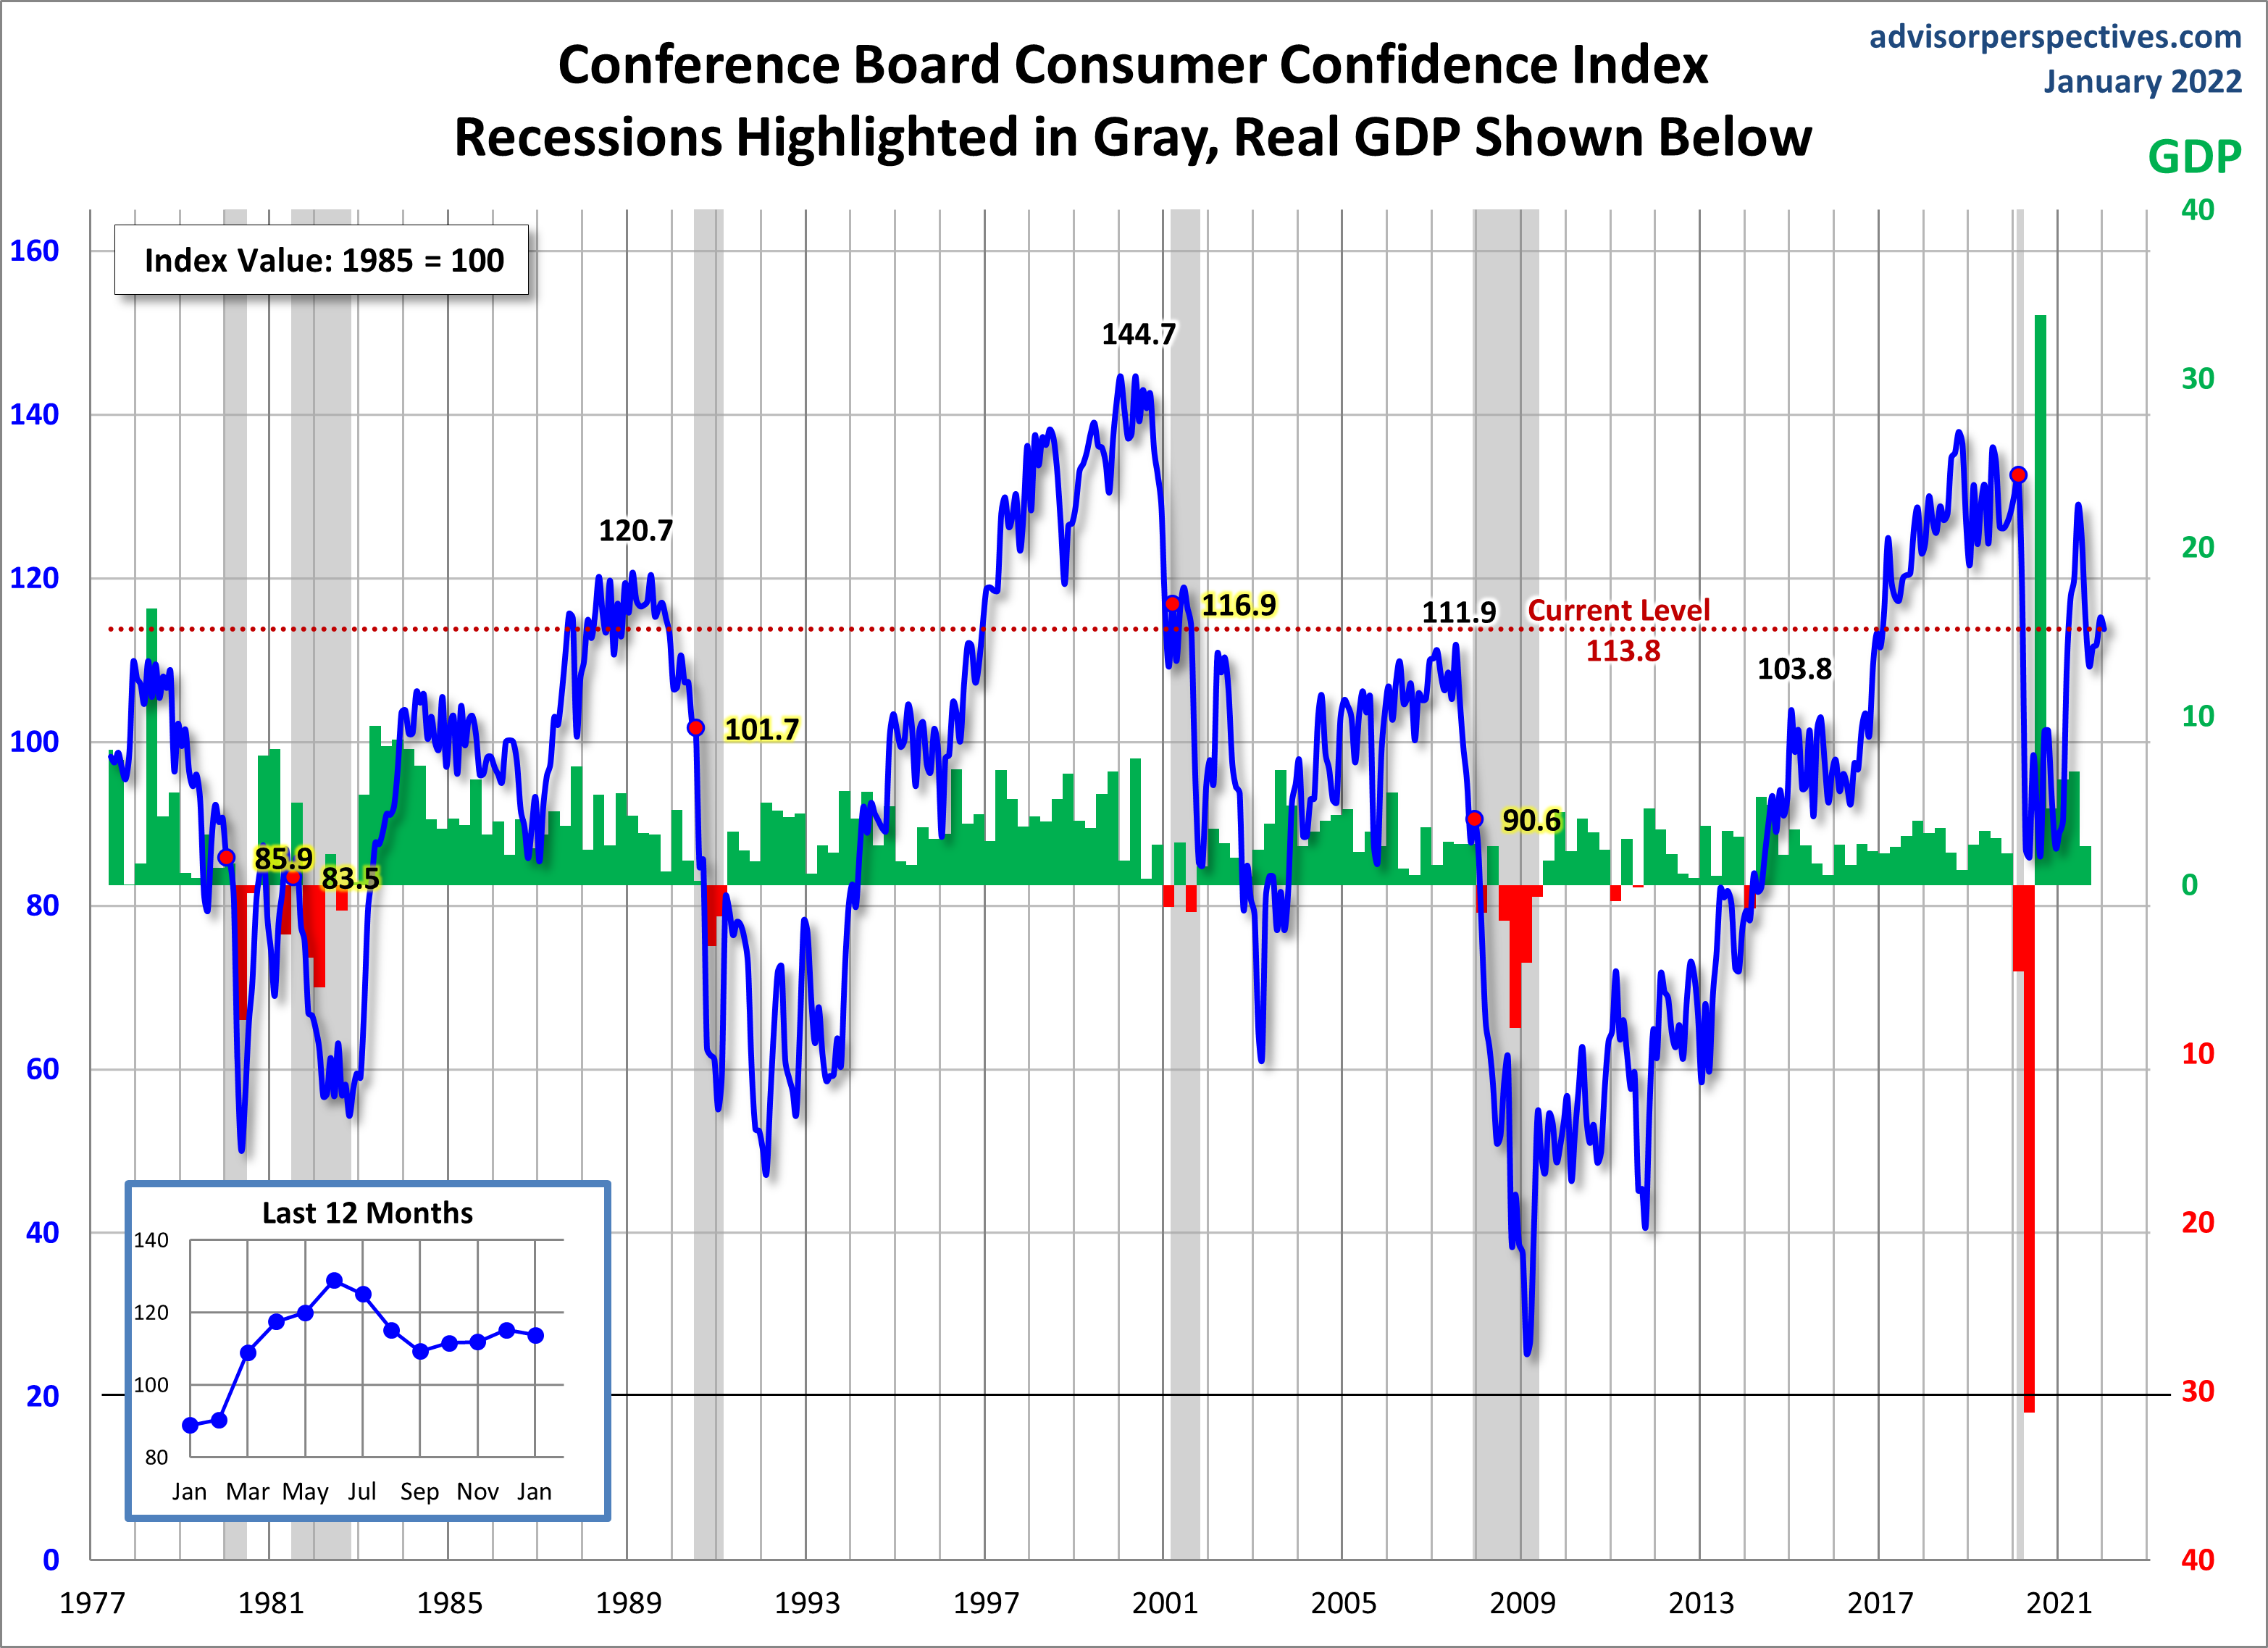
For the sake of comparison, here is a chart of the Conference Board's Consumer Confidence Index (monthly update here). The Conference Board Index is the more volatile of the two, but the broad pattern and general trends have been remarkably similar to the Michigan Index.
And finally, the prevailing mood of the Michigan survey is also similar to the mood of small business owners, as captured by the NFIB Business Optimism Index (monthly update here).


