
Median Household Incomes By Age Bracket: 1967-2014
Earlier today we updated our commentary on household income distribution to include the Census Bureau's release of the 2014 annual data. Our focus was on arithmetic mean (average) household incomes by quintile (and the top 5%) over the 47-year history of this data series. The analysis offered some fascinating insights into U.S. household incomes.
But the classification misses the implications of age for income. Households are by no means locked into the same quintile over time. Young educated households with professional skills and aspirations will typically move into the higher earning brackets during their financial life cycles. Households dependent on income from unskilled labor and service employment will not see the same financial progress over the years.
So let's review the household income data another way, this time focusing on the incomes by the age bracket. The data we're analyzing is the median household income the age brackets for the heads of household (see Table H.10).
Because this is a longitudinal analysis across nearly four decades, including the stagflation of the 1970s, we've used the Census Bureau's real (inflation-adjusted) series chained in 2014 dollars based on a research variant of the Consumer Price Index, the CPI-U-RS. In other words, the incomes in earlier years have been adjusted upward to the purchasing power of the most recent year in the series.
The first chart shows real household incomes of the six age brackets.

But more revealing is a comparison of the cumulative real growth of median incomes for the six age brackets.

Let's focus on the plight of the peak earning age bracket, ages 45-54.

There are some immediate observations we can make about these charts:
- In the first chart we see clearly that the 45-54 age bracket lays claim to the peak earning years for U.S. households.
- In the second chart we see that the two older age brackets have cumulative growth superior to the peak earnings bracket. In fact, the 65 and older has been the best performer over all, and it has especially outperformed since the recession of 2001. We can no doubt attribute the outperformance to the contribution of Social Security to the income stream. It's a reliable source of income and carries a cost of living adjustment. Private and government pensions also contributed to the superior growth rate.
- In the third chart we see in isolation the earnings decline for the households in the peak ten-year bracket. They have experienced a real decline of 15.6% in earnings over the 14-year period, although the 2014 data point is off the interim low set in 2011. The reasons, of course, can be widely varied — periods of unemployment, salary cuts, layoffs followed by a lower paying new job, a multiple-earner household in which one of the earners is a victim of unemployment, reduced employment, etc.
- The 21st century has seen a remarkable decline in income for the first four age brackets, and with the onset of the Financial Crisis of 2008, incomes for the 55-64 bracket have joined the downward trend.
- The age cohort with the grimmest history, of course, is the 15-24 bracket. In real terms, this cohort has the same income as in 1967. However, the 2014 data point is off the 21st century low in 2010, no doubt because it is the cheapest and a relatively abundant source of labor.
As we saw in the quintile analysis of household incomes, most cohorts are off their interim lows but have a long way to go before setting new highs. When we slice the data by age cohorts, we likewise see some distressing long-term trends.
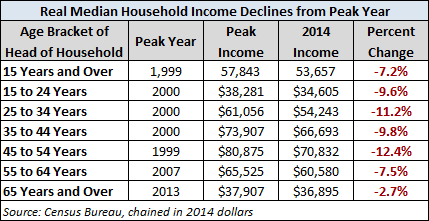
For more precise quantification of household income declines in recent years, here is a table showing the peak income year for each age bracket, the 2014 income, and the percentage change since the peak.
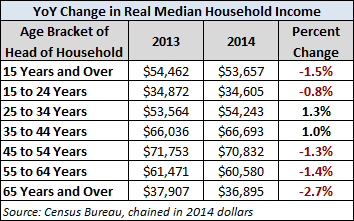
How about the year-over-year changes from 2013 to 2014? The second chart above illustrates the general decline incomes for most of the cohorts. Only two of them saw a real YoY increase in 2014 -- the youngsters and oldsters, which are also the two lowest earners, as we saw in the first chart. Let's quantify the latest YoY change in median incomes.
The lack of sustained growth in household incomes is no doubt a major factor in the general decline in consumer confidence since 2000, which was, after all, the peak year for four of the six cohorts, including the one with the highest income.

Here are links to the consumer and small business confidence indicators we track. They all have conspicuous correlation with income data.
- Michigan Consumer Sentiment Index
- Conference Board Consumer Confidence Index
- Small Business Optimism Index
Implications for the Economy
Of course the problem of shrinking incomes extends beyond the households to the economy as a whole. If households have less money for consumption, businesses suffer, which in turn leads to layoff and further declines in household incomes. Governments receive less in tax revenues, and the financial burden of social programs increases.
Ultimately this cycle of contracting household incomes will reverse, and incomes will rise. We can certainly hope we're in a bottoming process with some glimmers of a reversal But in the 47-year history of this data series, there has never been such a sustained period of contraction as is now the case for five of the six cohorts. Only the 65 and older households have respectable slopes in the snapshots above, and that, as mentioned above, is largely the result of Social Security with its history of Cost-of-Living Adjustments and, for some in that cohort, private and government pensions.
A Note on Census Bureau Revisions to the 2013 Data
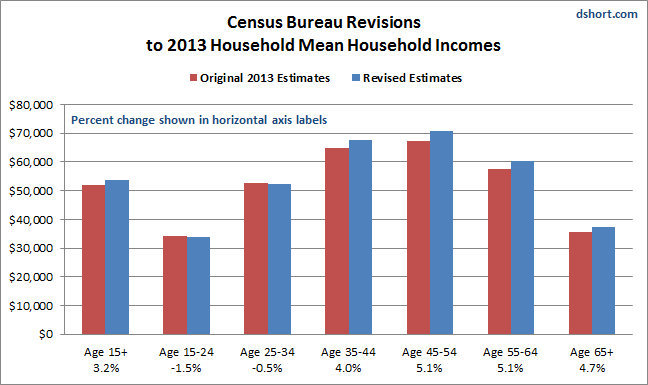
The CB's release of the 2014 data was accompanied by a PDF report, Income and Poverty in the United States: 2014. The report includes an explanation for their revisions in the latest annual report to the 2013 data, revisions that range from miniscule to substantial. Here is a column chart showing the pre- and post-revision data for the quintiles and top five percent discussed above.
The CB provides a detailed explanation for the revisions in Appendix D in the PDF file linked above. In essence, the revisions are the result of redesigned questions for income and health insurance coverage.
For more information on the Census Bureau's Current Population Survey (CPS), visit the CPSFrequently Asked Questions page. A question we've often been asked over the years is what qualifies as income in CPS household survey. The CPS definitons page lists the following:
- Earnings
- Unemployment compensation
- Workers' compensation
- Social security
- Supplemental security income
- Public assistance
- Veterans' payments
- Survivor benefits
- Disability benefits
- Pension or retirement income
- Interest
- Dividends
- Rents, royalties, and estates and trusts
- Educational assistance
- Alimony
- Child support
- Financial assistance from outside of the household
- Other income
Disclosure: None.


