Median Household Income In March 2021
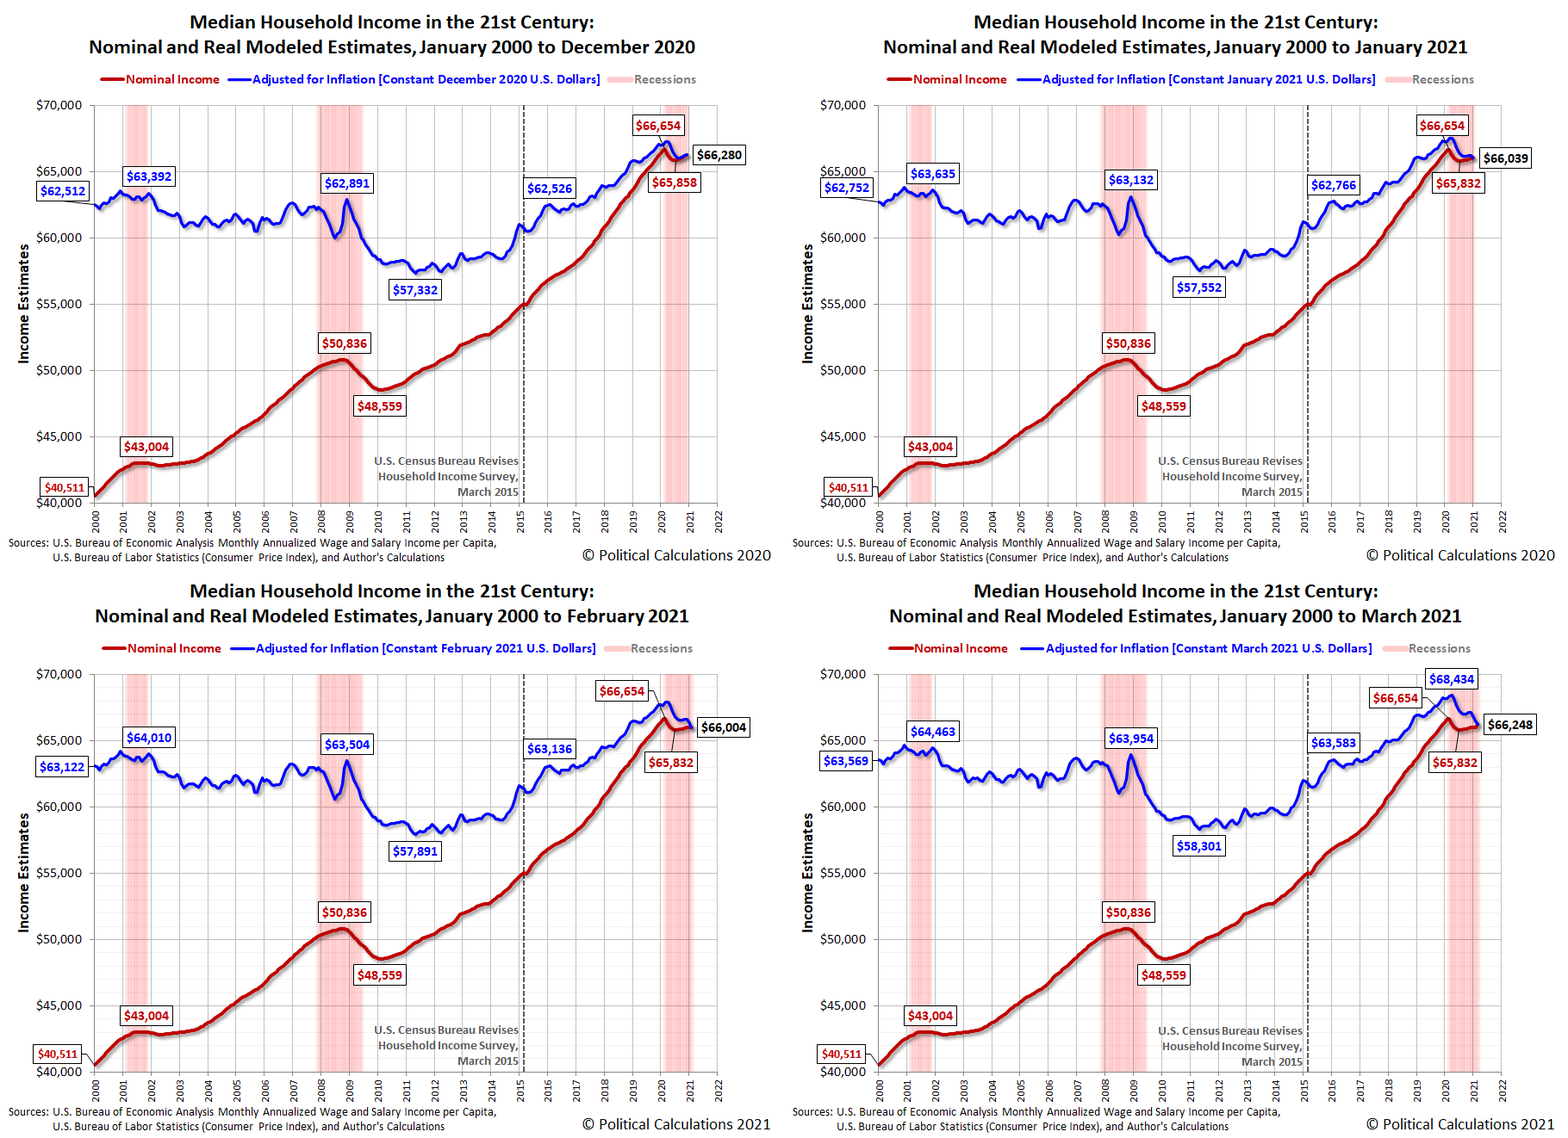
Political Calculations' initial estimate of median household income in March 2021 is $66,248, an increase of $244 (or 0.4%) from the initial estimate of $66,004 for February 2021. As expected, this change coincides with the lifting of coronavirus lockdowns imposed by several state and local governments in December 2020.
The latest update to the chart tracking Median Household Income in the 21st Century shows the nominal (red) and inflation-adjusted (blue) trends for median household income in the United States from January 2000 through March 2021. The inflation-adjusted figures are presented in terms of constant March 2021 U.S. dollars.
While the lifting of lockdown restrictions is a positive development for American households, it is being accompanied with rapidly rising inflation. In the following animated chart, we see that inflation has gained considerable traction in the U.S. since the end of 2020.
With inflation rising faster than the median household income in the U.S., the typical American household has been losing purchasing power during the first three months of 2021.
Analyst's Notes
The BEA's estimates for aggregate wage and salary data in January and February 2021 were revised slightly upward, by 0.08% and 0.11% respectively, from the Bureau's previous estimates.
References
U.S. Bureau of Economic Analysis. Table 2.6. Personal Income and Its Disposition, Monthly, Personal Income and Outlays, Not Seasonally Adjusted, Monthly, Middle of Month. Population. [Online Database (via Federal Reserve Economic Data)]. Last Updated: 30 April 2021. Accessed: 30 April 2021.
U.S. Bureau of Economic Analysis. Table 2.6. Personal Income and Its Disposition, Monthly, Personal Income and Outlays, Not Seasonally Adjusted, Monthly, Middle of Month. Compensation of Employees, Received: Wage and Salary Disbursements. [Online Database (via Federal Reserve Economic Data)]. Last Updated: 30 April 2021. Accessed: 30 April 2021.
U.S. Department of Labor Bureau of Labor Statistics. Consumer Price Index, All Urban Consumers - (CPI-U), U.S. City Average, All Items, 1982-84=100. [Online Database (via Federal Reserve Economic Data)]. Last Updated: 13 April 2021. Accessed: 13 April 2021.
Disclaimer: Materials that are published by Political Calculations can provide visitors with free information and insights regarding the incentives created by the laws and policies described. ...
more


