

Welcome back, readers. We appreciate that several of you reached out these past few weeks with your comments about our services and the kind things you shared about this weekly column. Thank you.
The stock market gyrated this past week, as it was heavily influenced each day on another new (and negative) data point. As you may be well aware, the markets have just gone through a mild two-week pullback, with the Nasdaq and the Dow essentially giving up most of their year-to-date gains.
Small- and mid-cap stocks are now underwater year-to-date. However, the S&P 500 maintained its positive footing as the positive move in the large mega-cap tech stocks still maintain a 30%+ weighting in the index.
Economic Data Provides a Negative Backdrop, For Now
Thursday started out with a tepid GDP report of just 1.6% growth and higher first quarter inflation. This immediately was picked up by investment analysts and news media as the “US economy has hit stagflation."
Friday, the core PCE data showed the uptick in inflation, which came out at 2.8% year-over-year versus the expectations of 2.7%. The biggest driver to this was service inflation of 0.4% for the month of March. Personal spending rose 0.8%, while personal income rose just 0.5% during this period. A big negative to the report was the fact that the personal savings rate fell to 3.2% from 5.2% a year ago.
This speaks volumes that the consumer is tapped out and doesn’t have much more to spend to keep up with the inflationary environment, and the GDP report showed a dramatic slowdown in the growth of the economy (Thanks to Jeffrey Hugh for some of these numbers).
This is humorous to me, given that Mish has been on national TV as far back as nine to 12 months ago, suggesting stagflation was coming, along with low growth and persistent inflation. Now, it seems every analyst and talking head utters this word (stagflation) about once a day.
Additionally, this word can be heard in other parts of the world, as many developed countries' economic backdrops look similar to those of the US: slow growth and elevated inflation. See chart below:

Wage growth is also slowing (not helping), which could reduce the savings rate and GDP in the near-term. See chart below:
![]()
If one were to strip out government spending the past year ($6.8 trillion deficit in the past 12 months), one would see that we are actually in a negative GDP environment, except for government spending.
We have frequently stated on the record that we saw interest rates staying higher for longer. We also want to be clear that earlier this year, we suggested that there would be no interest rate cuts by the Fed until later on in 2024. In fact, we have alluded to the fact that the Fed should consider hiking interest rates instead of cutting them.
This week, the odds shifted dramatically from cutting rates at the June meeting to probably not cutting until later in the year, if at all. Some expectations have also shifted to odds improving for another hike. See the charts indicating this below:

To us, it is a fact that the longer rates remain elevated, the greater the effect this restrictive monetary policy may have on the economy. This may result in the US economy slipping into a recession. If the market gets wind of this and breaks down, then it would be highly likely that the Fed would cut rates to repair the damage done by a negative stock market and stifling economy. That is how it could play out.
As we mentioned above, we could even see the Fed hike rates one more time if they feel that the recent uptick in inflation is too much. See the charts below showing how dramatic the Fed’s position has changed these past few months:


On the Bright Side
We are in earnings season, and many of the companies that have reported so far have exceeded expectations. According to FactSet, 46% of S&P 500 companies have now reported their Q1 2024 results, with 77% beating their earnings estimates and 60% reporting revenues above estimates
These are good numbers so far, and these earnings expectations may very well hold up the markets while interest rates stay high and inflation remains elevated and sticky.
Such was the case this past week with three of the Magnificent Seven stocks. Meta (Facebook), Microsoft, and Google all beat their expectations. Meta was down more than 10% after reporting a negative outlook for Q2. Microsoft and Google blew away earnings.
These three companies (META, MSFT, and GOOG) all stated the same narrative during their earnings calls. They are upping their AI cap-ex dramatically, and that helped Micron (MU), Super Micro Computer (SMCI), and Nvidia (NVDA) all have a big up day on Friday as investors now understand the semiconductor companies involved in AI are the biggest beneficiaries of this cap-ex spending cycle.
The Nasdaq was up 1.7% on Friday and 3.6% on the week. Semiconductor stocks, which were down over 9% last week, regained their upward bias and were up over 9% this past week. See chart below:

As mentioned above, Google was the big surprise winner after they posted blow out earnings on Thursday. A couple of historical milestones were achieved for them on Friday. See charts below:


The S&P 500 had a good week, as it roared back from its recent, short-lived correction. See charts below:


Unfortunately, due to the higher inflation numbers and the certain delay in the Fed cutting rates, fixed income funds (bonds) sold off as rates rose to their highest levels in 2024. See chart below:

A Deeper Dive Into the Markets and Current Set-Ups
I want to provide a few different perspectives, both positive and negative, on where we are currently with stock market sentiment, seasonality, etc.
You may recall just a few weeks ago that I showed charts indicating that the latter half of April tends to be good (after the dreaded tax season ends). Therefore, it is no surprise that we saw a positive bias this past week, even though there was negative inflation and slowing GDP news. See chart below that is similar to the one I posted a few weeks ago:

Retail investor sentiment recently soured. The AAII (American Association of Individual Investors) Bull-Bear spread dropped into negative territory for the first time since early November.
This may have coincided with the recent pullback and/or many of these individual investors believing we are entering the worst six months of the year for the stock market. See chart below:

However, as pointed out below, the worst six months during an election year can still be quite good.

Not surprising is the fact that US Large-Cap Equity funds saw a big inflow of capital this past week. I suspect enough people believe we were overdue for some pullback and were convinced that we remain in a “bull” market. Investors stepped in and bought. See chart below:

Fund manager positioning, however, has become cautious. Currently funds relative exposure to cyclicals versus defensive sectors, high beta versus low beta, and value versus momentum stocks are all below average.
This was clearly seen in Keith’s column last week that showed Value had rotated into favor. It's not certain if that will last, but over the past few weeks, value stocks (energy and utilities) have been the leaders until some of the growth stocks (Alphabet & Microsoft) reported this past week. See fund manager positioning chart below:

Of all 13 bull markets since WWII, this is the worst 18-month performance for small-cap stocks. See chart below:

Normal Market Weakness During an Election Year
I wanted to show the following chart that was posted earlier in the week. This was before we incurred most of the “snapback” rally. It is important to note that election years tend to be positive and produce positive returns. The following chart was posted by Ryan Detrick at The Carson Group.

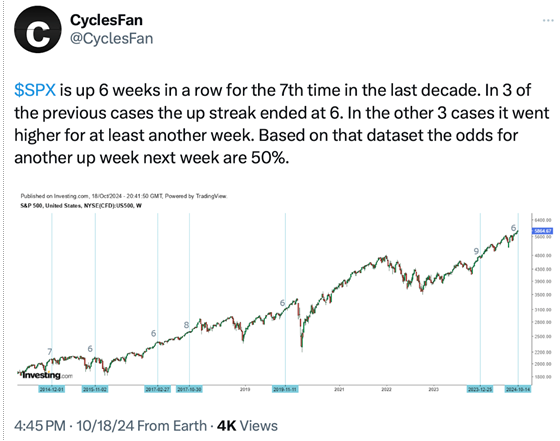
And last but not least, I wanted to show a very important statistic that exists after the S&P 500 is down for six consecutive days, as it was last Friday. See chart below:

Now, here are some other factors that may play a part in the week's trading.
Risk On
- Most sectors were up this week, led by Semiconductors, Homebuilders, and Consumer Discretionary.
- Foreign equities, led by China and Hong Kong stock markets, pushed global markets higher, supporting the narrative of a strong global economy.
- As we highlighted last week, market internals were looking overdone on the downside and are now are back in positive territory, with the McClellan Oscillator moving positively for both the S&P 500 and Nasdaq composite.
- The volatility ratio continued to bounce off of oversold levels and on a short-term basis.
- Foreign equities were strong, led by emerging markets that moved back into a bull phase.
- Copper exploded to the upside, which is a positive sign for the overall economy.
Risk Off
- Despite the strong move up this week, volume patterns remain weak, with zero accumulation days seen in the S&P 500.
- Transports did not do well this week and look to be under pressure, closing under the 10-day moving average.
Neutral
- Equity markets had a strong week with all four indexes closing positive, led by the Nasdaq, which was up almost 4% for the week. However, we still closed in a warning phase, creating a mixed message regarding the short-term downtrend line which has remained intact from the bearish engulfing pattern set in early April.
- The new high/new low ratio bounced from oversold levels and still has more potential upside for both Nasdaq and NYSE. However, the 10 and 21-Day moving averages are still negative.
- Risk gauges improved to a weak neutral reading with the improvement seen in the SPY/TLT ratio.
- Cash volatility backed off from overbought levels and appears to be at a key inflection point, sitting at both the 50- and 200-day moving averages.
- For stocks above key moving averages, there were significant improvements with the rally. However, the number of stocks above the 50-day moving average in both key indexes remains under 50%.
- Rates trended higher, though they may have peaked, as real motion indicators showed oversold levels about two weeks ago before coming back into long-term support.
- Growth stocks continue to underperform value, but that could flip as value stocks are on the cusp returning into negative territory on a relative basis.
- Soft commodities are in the process of digesting explosive gains to the upside, but still held their 10-day moving average.
- Gold is sitting in a bull phase, but it is still under its 10-Day moving average, digesting its recent move over the last couple months.
- The Japanese yen hit a 34-year low relative to the US dollar, as driven by the interest rate differential and a cooling Japanese economy.
More By This Author:
Unexpected Inflation Headline - Who Should You Believe?Powell Says Higher Inflation Is Acceptable And The Stock Market Surges
The Bull Keeps Running - What Does The Strength Over The Last 60 To 120 Days Mean?

Comments
Log in or sign up to join the conversation.