
Markets At All-Time Highs: What It Means Going Forward
Several stock market indexes made historical highs last week, with the widely watched S&P 500 (SPX) index trading above 3100. Understandably, this is generating some concerns among investors. After all, we are always looking to buy low and sell high, so seeing the market at historical highs could be indicating that this is a good time to be selling as opposed to buying.
This idea makes sense from an intuitive point of view, but it's not backed by evidence. On the contrary, the data shows that strength begets strength in the stock market, and buying when the market performing strongly tends to produce superior returns over the long term.
Winning Markets Tend To Keep On Winning
The chart from AllocateSmartly shows the historical backtested performance of a remarkably simple strategy. It goes long the global stocks index (ACWI) when such an index makes a new all-time high at the end of the month, otherwise, the strategy is allocated to bonds.
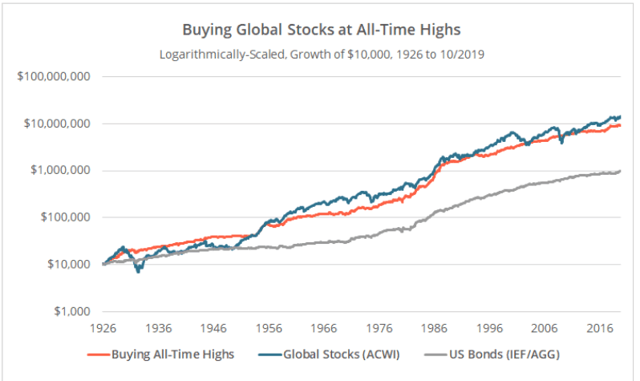
Source: AllocateSmartly
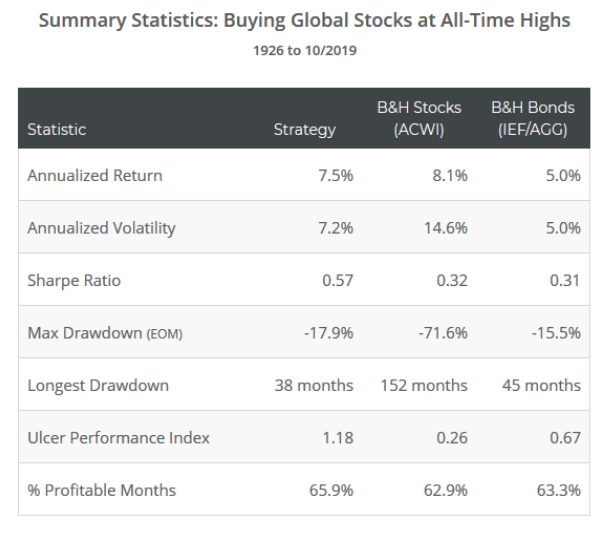
The strategy produces smaller gains than buy and hold, but it substantially outperforms in terms of downside risk and risk-adjusted returns. The maximum drawdown, meaning maximum capital loss from the peak, is -17.9% for the strategy versus a much larger drawdown of -71.6% for buy and hold investors.
Source: AllocateSmartly
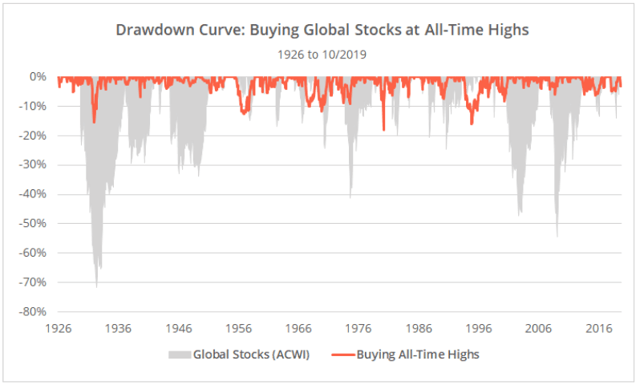
Providing more details, the chart below shows the maximum drawdowns for the trend-following strategy versus buy and hold in the ACWI Index. The benefits in terms of risk reduction are enormous.
Source: AllocateSmartly
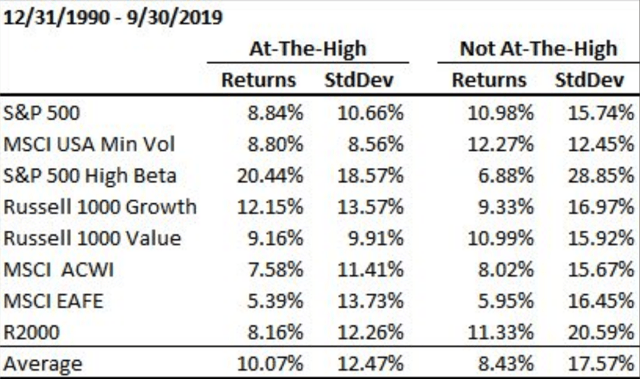
The table shown below from EconomPic calculates the returns from this strategy applied to different indexes from 1991 to September 2019. The risk and reward equation clearly improves when buying at all-time highs in different kinds of indexes.
Source: @EconomPic
Risk-Reward and Market Behavior
These kinds of statistics do not predict the future. But the markets are made by humans and by algorithms that are designed by humans. To the extent that human behavior does not change much over time, it is reasonable to say that strength begets more strength in the stock market.
Many investors seem to believe that the market is more prone to crashing down after making all-time highs. However, that's not what usually happens.
When stocks are making new highs, chances are that prices will continue doing well in the middle term. The big market crashes usually come after markets have been weak for quite some time and trading well below their historical highs.
Volatility usually increases, and market losses tend to accelerate once stocks are already declining. The chart below shows the evolution of the S&P 500 index and the 200-day moving average since 1998. The two big declines in 1999 and in 2008 came when the index was trading below the 200-day moving average.
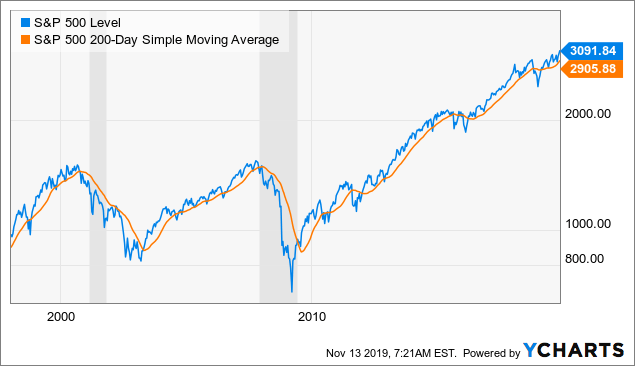
Data by YCharts
It's not every time that the index goes below the 200-day moving average that we get a market crash. However, investors protecting the portfolio when prices are below such a trend indicator would have avoided massive drawdowns in both the 1999 and 2008 bear markets.
Mebane Faber's research paper entitled "A Quantitative Approach to Tactical Asset Allocation" takes a look at historical returns and volatility for different asset classes when they are either above or below the 10-month moving average.
The data is quite clear: When prices are in an uptrend - defined as being above the moving average - most asset classes tend to deliver both higher returns and lower volatility than when they are in a downtrend.
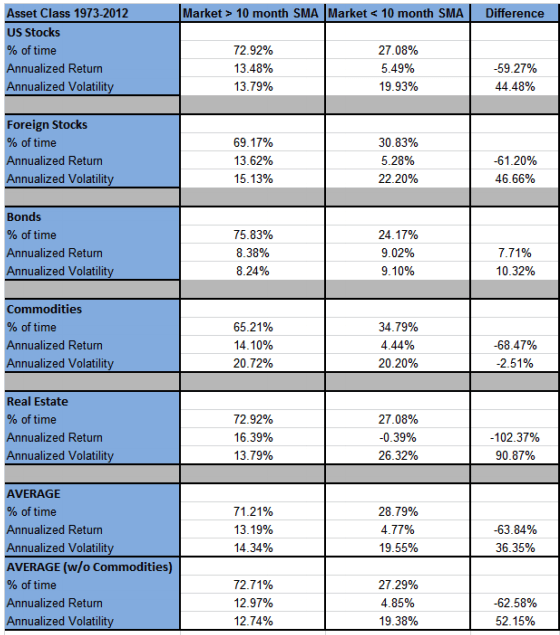
Source: A Quantitative Approach to Tactical Asset Allocation
Combining Trend-Following And Relative Strength
In order to combine trend-following and relative strength, we can consider a strategy such as The Asset Class Rotation Strategy. This is a quantitative system that rotates between 9 ETFs that represent some key asset classes.
- SPDR S&P 500 Trust ETF (SPY) for big stocks in the U.S.
- iShares Russell 2000 ETF (IWM) for small U.S. stocks
- iShares MSCI EAFE ETF (EFA) for international stocks in developed markets
- iShares MSCI Emerging Markets ETF (EEM) for international stocks in emerging markets.
- Invesco DB Commodity Index Tracking ETF (DBC) for a basket of commodities
- SPDR Gold Trust ETF (GLD) for gold
- Vanguard Real Estate ETF (VNQ) for REITs
- iShares 20+ Year Treasury Bond ETF (TLT) for long-term treasury bonds
- iShares 1-3 Year Treasury Bond ETF (SHY) for short-term treasury bonds
In order to be eligible, an ETF has to be in an uptrend, meaning that the current market price is above the 10-month moving average. Among the ETFs that are in an uptrend, the system buys the top 3 with the highest risk-adjusted returns over 3 and 6 months.
The portfolio is monthly rebalanced, and the benchmark is the All-World 60-40 Benchmark (BNCH), which is a global portfolio of stocks and bonds holding 60% in stocks and 40% in bonds.
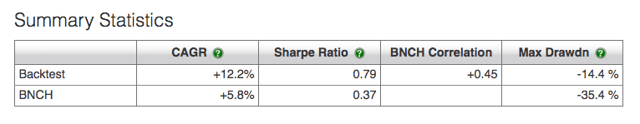
The charts below show the historical performance numbers for the ACR Rotation Strategy since January 2007. The total return for the strategy amounts to 340% versus 105.6% for the benchmark. More importantly, the maximum drawdown for the strategy is -14.4% versus -35.4% for the benchmark.
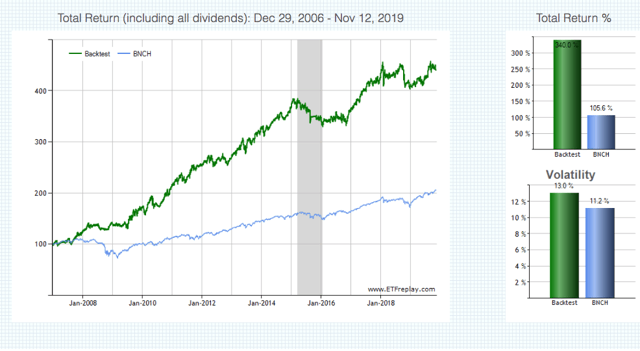
Source: ETFReplay
We can gain a deeper understanding of how the strategy works by looking at the annual return numbers for different periods.
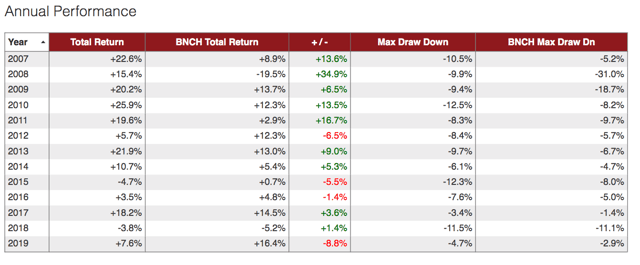
The strategy's worst year was 2015, and the annual loss in that year was a very manageable -4.7%. The fact that the strategy tends to produce positive returns, and losses are generally small when they happen, is arguably the most attractive advantage.
That said, in years such as 2015 and 2018, when the main trends in different asset classes were weak and short-lived, the strategy produced unattractive returns. The main problem is not that it made any big bad bets in those years, but rather many positions with mediocre returns.
A quantitative strategy such as this one will hardly spend a lot of time in an underperforming position. However, when a particular asset is showing signs of strength, the strategy tends to buy it. If such an asset then reverses down, the strategy will ultimately buy at high prices and sell at low prices.
Also, it takes time for the strategy to incorporate signals from the market into portfolio decisions, so rapid changes in price trends tend to hurt performance. The individual losses are not particularly big, but during times of sideways market conditions and choppy price action such as 2015 and 2018, the strategy can be expected to produce disappointing performance.
On the other hand, in years like 2008, when global stock markets collapsed and the S&P 500 had a maximum drawdown of 47.6%, the Asset Class Rotation strategy gained 15.4% by investing in safe haven assets such as Treasuries and gold.
Similarly, in years like 2017, in which risky assets boomed, the strategy also outperformed the market by a wide margin by investing aggressively in equities during times in which stocks were surging.
The strategy is based on price trends and momentum, so it can be expected to outperform during big bear and bull markets such as 2008 and 2017. However, it will probably generate disappointing numbers in sideways years such as 2015 and 2018.
In other words, buying strength tends to work over the long term, but it does not produce superior returns in each and every year.
Bottom Line
The fact that stocks are trading at all-time highs is understandably generating some fears among investors. A healthy dose of caution and skepticism does not hurt at all, and a market pullback in the short term is to be expected with prices reaching overbought levels.
However, only the fact that stocks are trading at all-time highs is no reason to stay away from the market. Buying on strength can produce mediocre returns in some years, but strong markets tend to continue delivering superior returns over the middle term more often than not.
Disclaimer: I wrote this article myself, and it expresses my own opinions. I am not receiving compensation for it. I have no business relationship with any company whose stock is mentioned in ...
more

