
Market Rally Heads Into July
SPX Monitoring purposes; long SPX 6/28/21 at 4290.61.
Monitoring purposes GOLD: Long GDX on 10/9/20 at 40.78.
Long Term SPX monitor purposes; Neutral
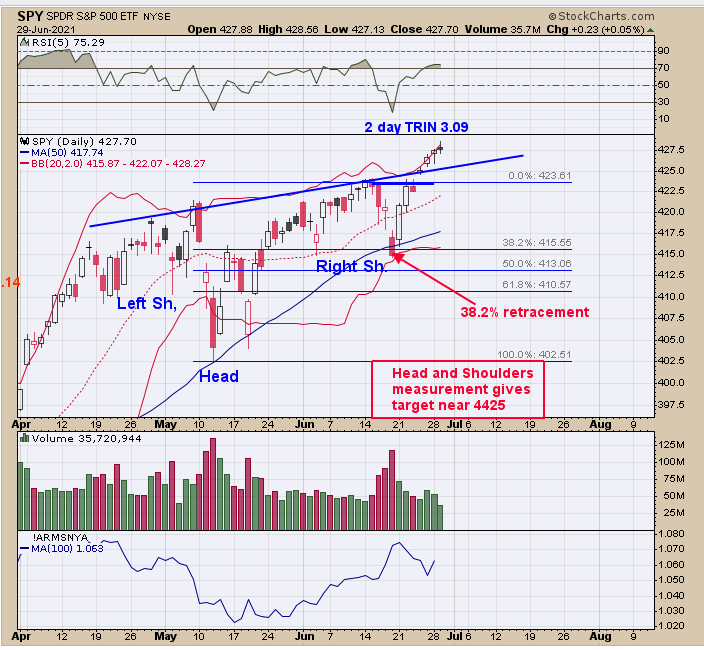
Today the two day TRIN closed at 3.09. Two day TRIN readings that add up to over 3.00 have been a buy signal for the market. Support now lies near the previous high which is about 1% lower. The pattern that appears to be forming is a Head and Shoulder bottom where the double Head came at the Mid May lows. This potential Head and Shoulders bottom has a measured target near 4425 on the SPX. Also noticed that the pull back to the June 18 was only a 38.2% retracement of the previous rally showing the market is in a strong position.

It’s a bullish sign when the TRIN rises above 1.30 as the market rises. The bottom window is the 3 day TRIN and next window up is the 2 day TRIN; both of which reached bullish levels today. The top window is the 10 day TRIN which is near the bullish levels. TRIN close above 1.30 on the close suggests there is panic in the market and panics are what market bottoms are made off. The higher the TRIN close the more bullish the sign for the market. When several TRIN closes above 1.30 occur in the market then the market is about to start another rally phase. Though the market has rallied from last Monday the TRIN readings suggests the rally should continue. Seasonality wise (which didn’t work last week as it was suppose to be down) is favorable into the third week of July.
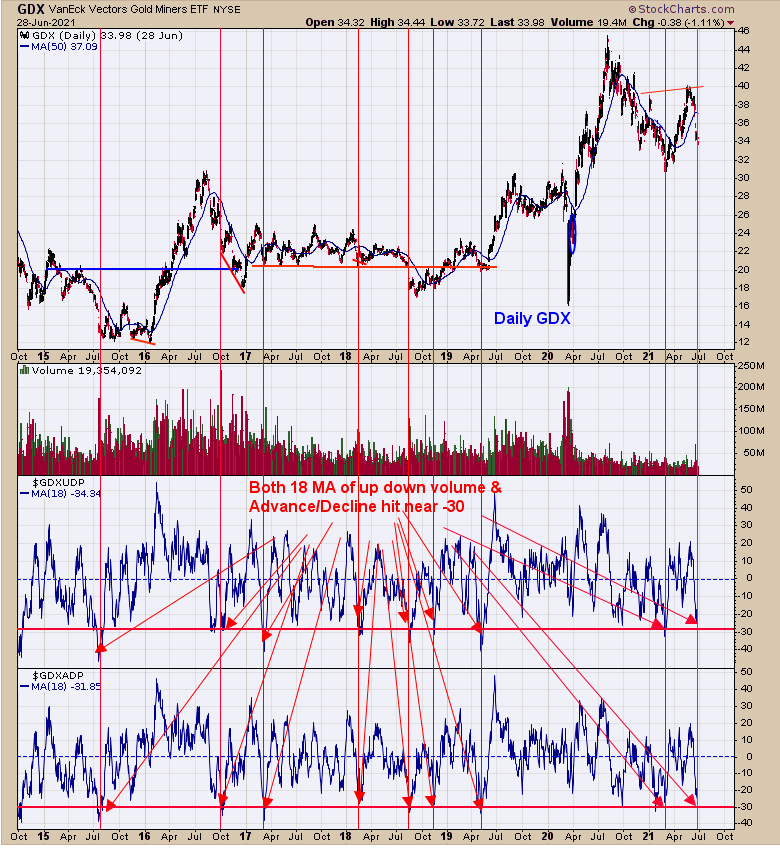
Bottom window is the Advance/Decline percent and next window up is the Up Down volume percent. Low in GDX can be expected when both indicator reach below -30 (and both have). This chart goes back to late 2014 and the red vertical lines show when both indicators reach below -30. Most rallies lasted several months after both indicators reached below -30. The last time both indicators reached below -30 came at the March 2021 low. Most traders are frustrated with gold and gold stocks and that is usually a good sign for an extended rally to start. There was also a “Selling Climax” on June 17 which adds to the bullish setup. Monthly chart remain bullish and this pull back from the May high is near an end. We pointed out yesterday that sentiment is also favorable for a bottom here. Long GDX 10/9/20 at 40.78).
Disclaimer: Signals are provided as general information only and are not investment recommendations. You are responsible for your own investment decisions. Past performance does not guarantee future ...
more

