
Market Overvaluation Reaching Warning Level
We now calculate that 63% of the stocks to which we can assign a valuation are overvalued and 30.63% of those stocks are overvalued by 20% or more. These numbers have increased significantly since we published our last valuation study.
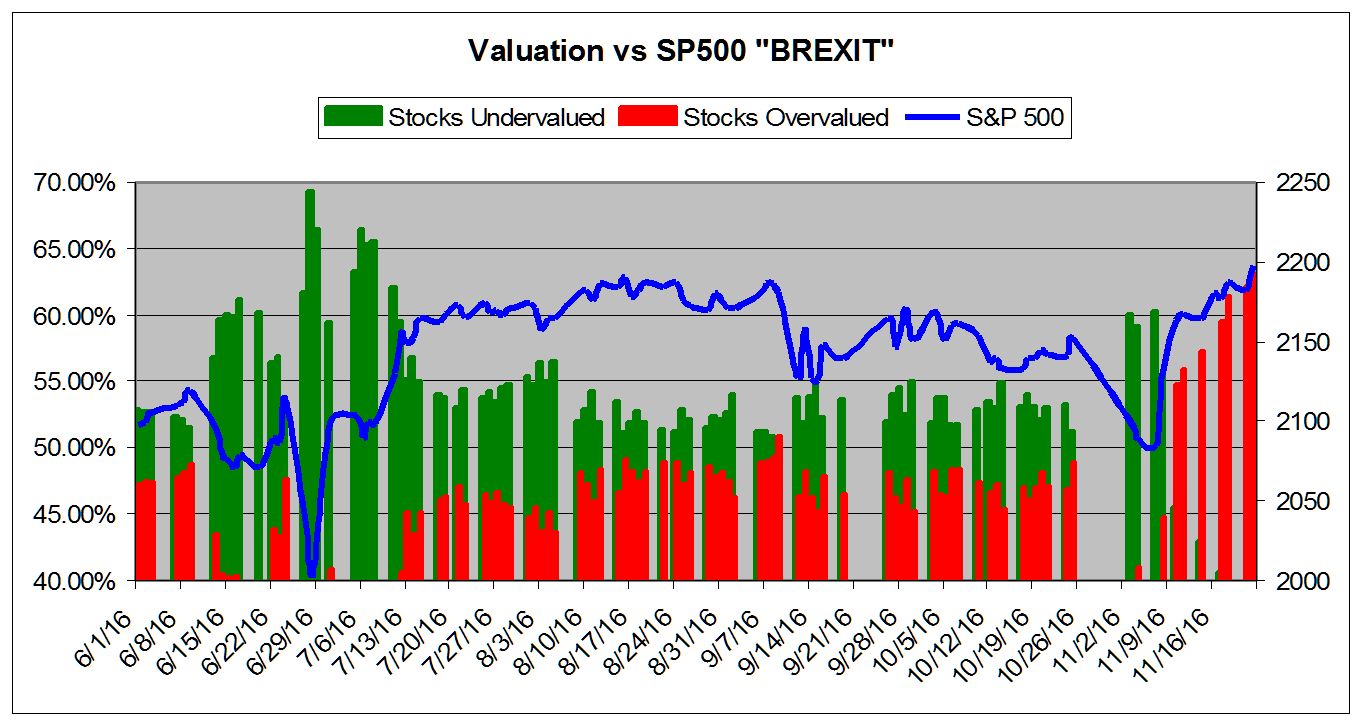
If the levels increase just two percentage points, we will issue our first valuation warning since June 2015. At that time, the SP500 was at the 2100 level. Needless to say, from our model's perspective, equities are nowhere near as "cheap" as they were back in late June of this year in the aftermath of "Brexit."
The last big surprise for stocks was the unexpected Trump election victory. We saw panic selling in the immediate aftermath, but the markets shook that off and since the election major indices have all laid in new record highs or are flirting with record territory. Small caps--the Russell 2000 index--have performed particularly well.
Again, the Trump victory, like the "Brexit," briefly shook markets, but markets came roaring back. We still expect some long-term negative effects from both events, but for now, we recognize again that following cries of panic based on short-term noise is NOT the right thing to do.
We believe that the latest market run up, along with the continued good employment data, makes it more likely that the Fed will raise rates at its next meeting in December. Of course, we believe they should delay until we really see workers benefiting from the improved economic environment. It would be a shame to move to soon when inflation remains in check.
The chart below tracks the valuation metrics so far this Summer/Fall. It encompasses the Brexit sell-off. It shows levels in excess of 40%.
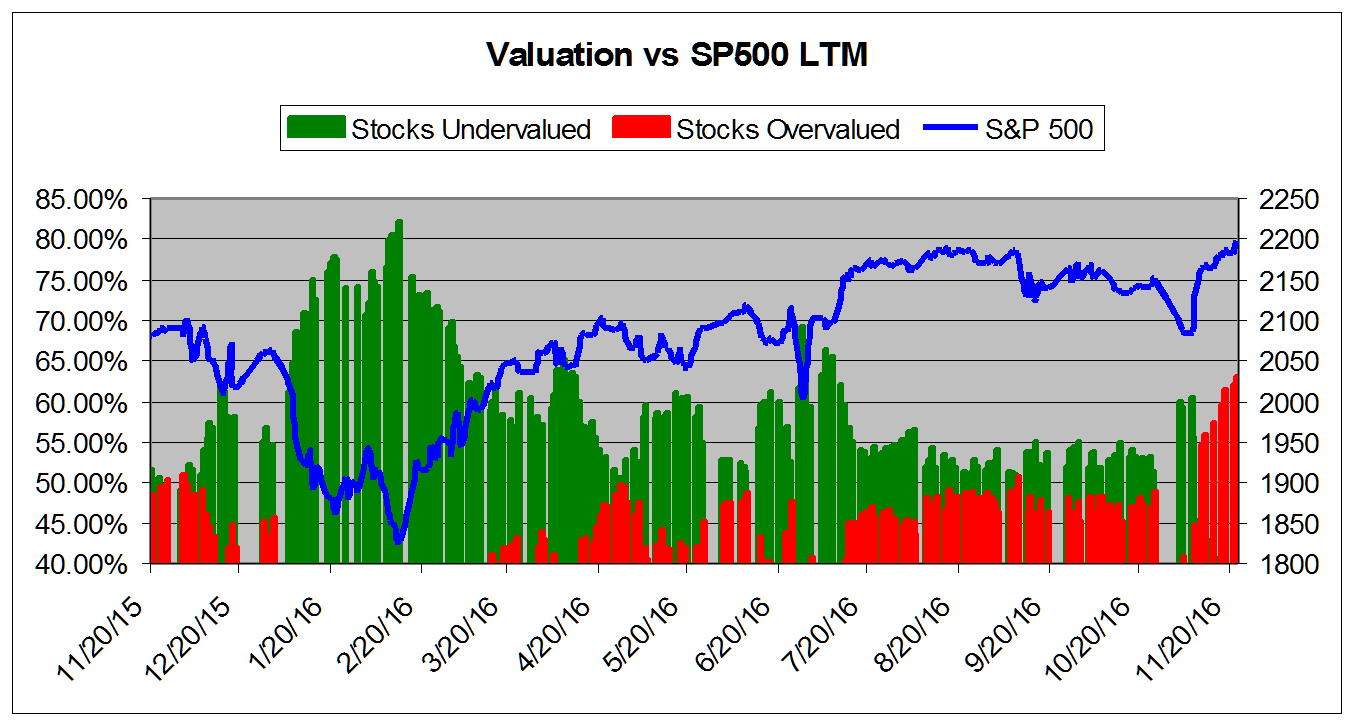
The chart below tracks the valuation metrics from August 2015. It shows levels in excess of 40%.
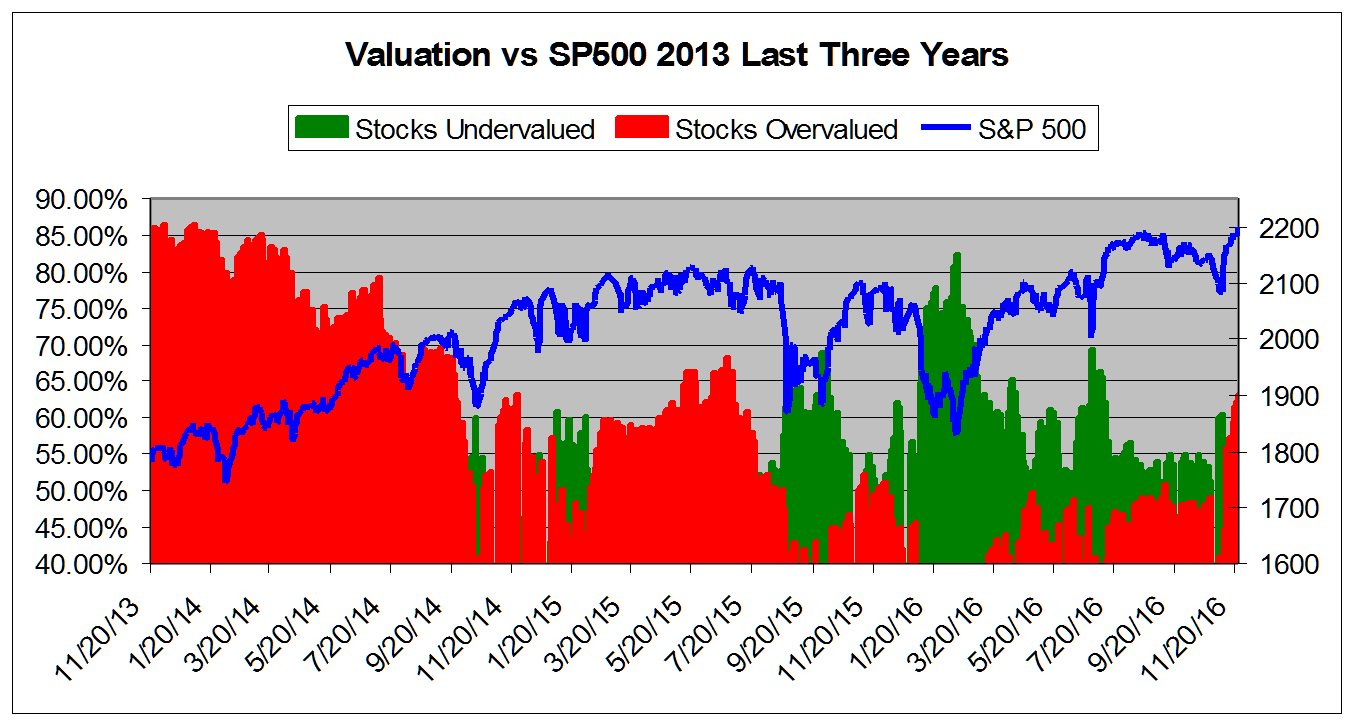
This chart shows overall universe over valuation in excess of 40% vs the S&P 500 from August 2013
This chart shows overall universe under and over valuation in excess of 40% vs the S&P 500 from March 2007*
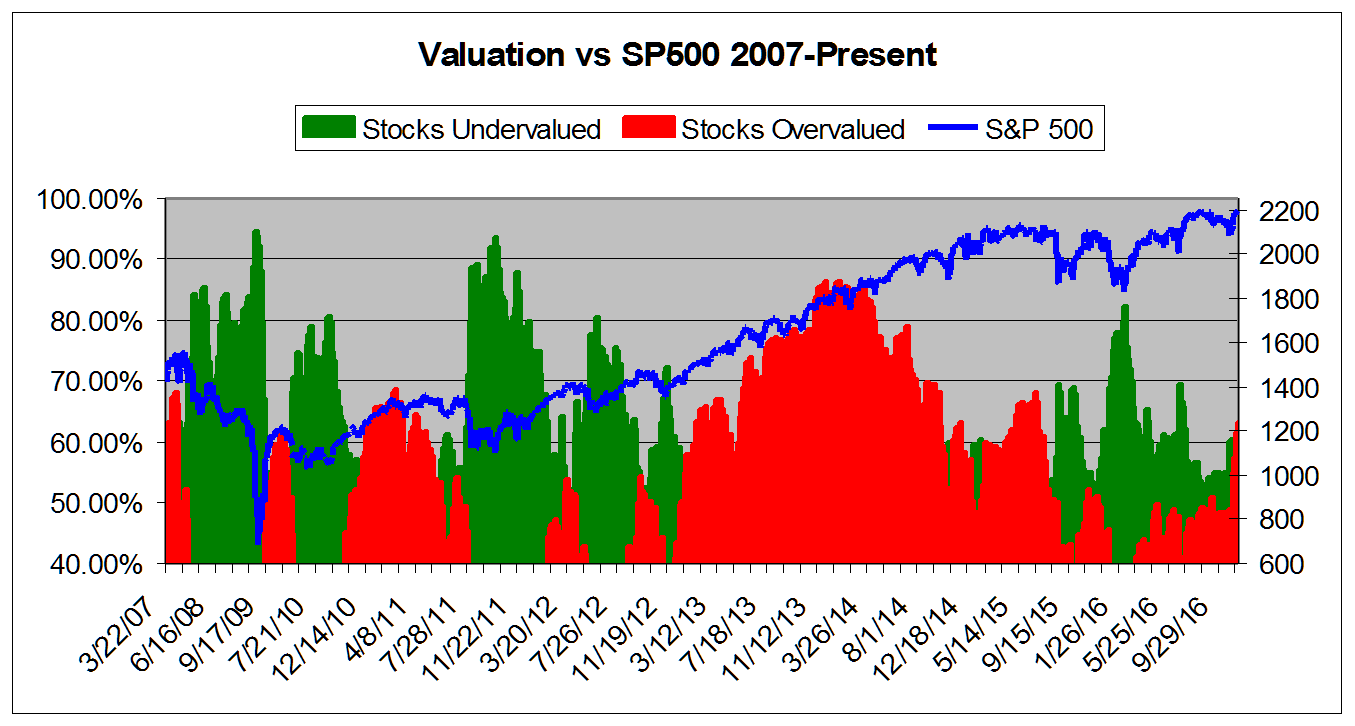
*NOTE: Time Scale Compressed Prior to 2011.
Market Overview
|
Summary of VE Stock Universe |
|
|
Stocks Undervalued |
37% |
|
Stocks Overvalued |
63% |
|
Stocks Undervalued by 20% |
15.83% |
|
Stocks Overvalued by 20% |
30.63% |
Sector Overview
|
Sector |
Change |
MTD |
YTD |
Valuation |
Last 12-MReturn |
P/E Ratio |
|
Multi-Sector Conglomerates |
0.57% |
3.48% |
9.80% |
21.88% overvalued |
3.28% |
19.20 |
|
Industrial Products |
0.71% |
7.08% |
23.15% |
20.50% overvalued |
15.22% |
23.82 |
|
Aerospace |
0.61% |
5.69% |
10.31% |
16.23% overvalued |
11.66% |
19.20 |
|
Oils-Energy |
2.30% |
3.37% |
35.87% |
14.37% overvalued |
6.35% |
26.18 |
|
Construction |
0.43% |
6.64% |
31.92% |
13.17% overvalued |
14.73% |
21.03 |
|
Transportation |
0.50% |
9.51% |
16.71% |
13.16% overvalued |
0.32% |
19.18 |
|
Computer and Technology |
0.24% |
4.83% |
20.61% |
12.16% overvalued |
8.45% |
29.65 |
|
Finance |
0.24% |
6.00% |
12.34% |
11.37% overvalued |
6.82% |
16.89 |
|
Business Services |
0.58% |
6.79% |
19.54% |
10.24% overvalued |
2.82% |
24.61 |
|
Basic Materials |
0.88% |
3.92% |
50.32% |
9.06% overvalued |
63.96% |
28.17 |
|
Consumer Discretionary |
0.18% |
3.90% |
9.72% |
6.99% overvalued |
8.53% |
23.82 |
|
Retail-Wholesale |
0.01% |
5.19% |
1.78% |
5.83% overvalued |
4.04% |
23.13 |
|
Utilities |
0.79% |
0.74% |
12.19% |
5.42% overvalued |
9.71% |
21.56 |
|
Consumer Staples |
-0.02% |
0.32% |
7.52% |
3.26% overvalued |
7.45% |
24.16 |
|
Medical |
0.02% |
3.95% |
1.12% |
1.23% overvalued |
-9.60% |
26.37 |
|
Auto-Tires-Trucks |
0.65% |
3.54% |
8.97% |
1.07% overvalued |
13.52% |
14.45 |
Disclaimer: ValuEngine.com is an independent research ...
more


Thanks for sharing