March 2021 Richmond Fed Manufacturing Survey Improves
Of the three regional Federal Reserve manufacturing surveys released to date, all are in expansion.
Analyst Opinion of Richmond Manufacturing
The important Richmond Fed subcategories (new orders and unfilled orders) are in expansion but the direction of growth was mixed this month. We consider this survey about the same as last month.
Market expectations from Econoday were 14 to 20 (consensus 15). The actual survey value was 17 [note that values above zero represent expansion].
Fifth District manufacturing activity expanded in March, according to the most recent survey from the Federal Reserve Bank of Richmond. The composite index rose from 14 in February to 17 in March, driven by a sharp increase in the shipments index while the other two components — new orders and employment — held steady. Businesses reported lengthened vendor lead times, as this index rose from 46 in February to 61 in March, breaking a 25-year-record for the third month in a row. Survey respondents were optimistic that conditions would continue to improve in the coming months.
Survey results suggested that manufacturers increased employment and wages in March. However, finding workers with the necessary skills remained difficult. Survey participants expected these trends to continue in the next six months.
The average growth rates of both prices paid and prices received by survey participants increased in March, as growth of prices paid continued to outpace that of prices received. Contacts expected the gap to narrow in the near future
Richmond Fed (hyperlink to reports):
Summary of all Federal Reserve Districts Manufacturing:
Kansas Fed (hyperlink to reports):
Dallas Fed (hyperlink to reports):
Philly Fed (hyperlink to reports):
New York Fed (hyperlink to reports):
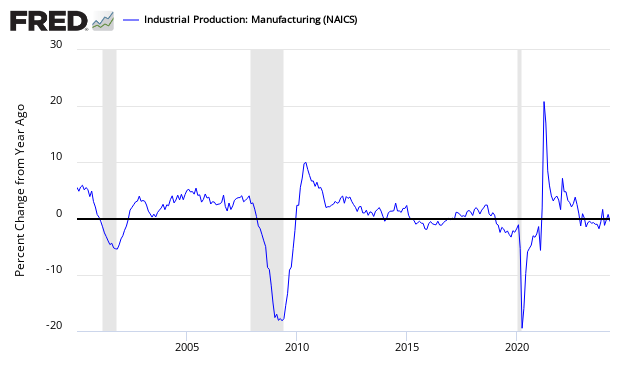
Federal Reserve Industrial Production - Actual Data (hyperlink to report):

Holding this and other survey's Econintersect follows accountable for their predictions, the following graph compares the hard data from Industrial Products manufacturing subindex (dark blue bar) and US Census manufacturing shipments (red bar) to the Richmond Fed survey (darkest bar).

In the above graphic, hard data is the long bars, and surveys are the short bars. The arrows on the left side are the key to growth or contraction.
Disclaimer: No content is to be construed as investment advise and all content is provided for informational purposes only.The reader is solely responsible for determining whether any investment, ...
more


