
Mapped: Gas Prices By U.S. State In 2025
(Click on image to enlarge)
Key Takeaways
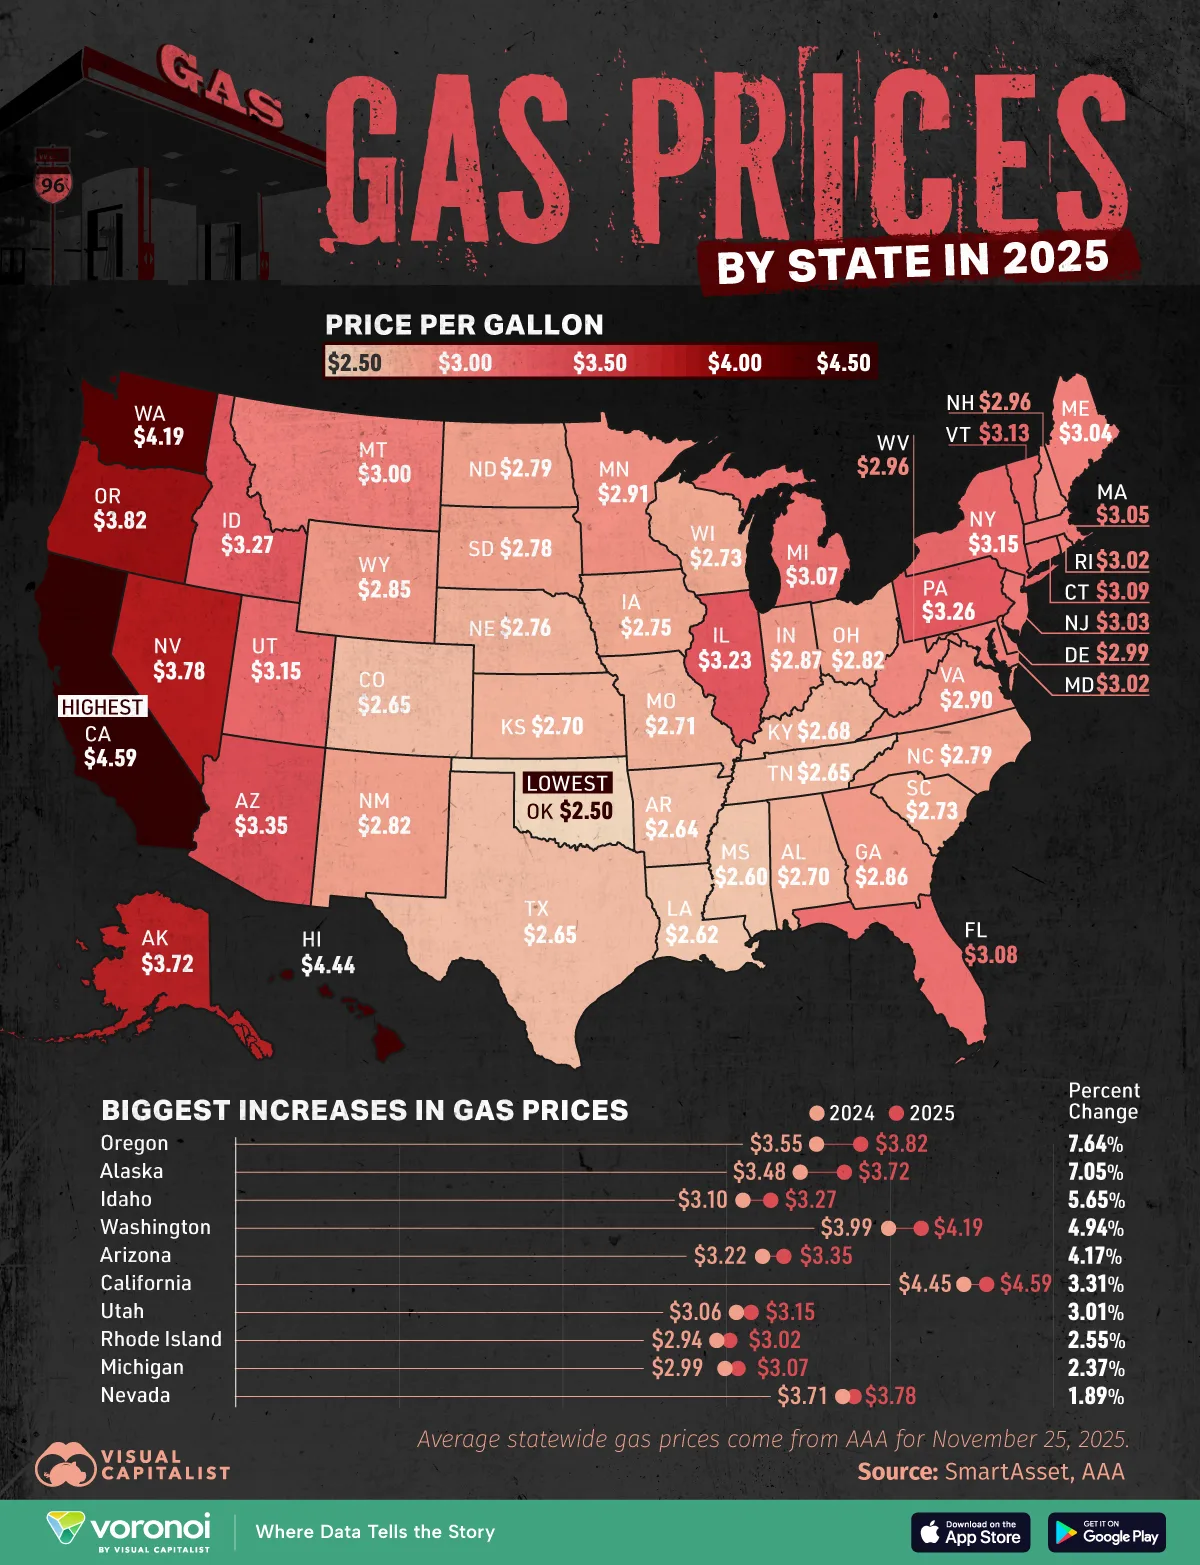
- California has the highest average gas price in the U.S. at $4.59 per gallon, while increases were most pronounced in Oregon, Alaska, and Idaho.
- Average statewide gas prices come from AAA for November 25, 2025.
Gas prices across the United States show significant variation heading into late 2025. While national averages remain relatively stable, regional differences highlight the impact of taxes, supply constraints, and transportation costs.
This map visualizes the average price for a gallon of regular gasoline in every state. The data for this visualization comes from AAA via SmartAsset.
West Coast Prices Remain the Highest
California once again leads the nation with an average gas price of $4.59 per gallon, maintaining its long-held position at the top due to higher taxes and strict fuel standards.
Hawaii and Washington follow closely, both remaining above $4 per gallon. These elevated prices reflect a combination of geographic isolation, environmental regulations, and limited refining capacity. As a result, the West Coast continues to be the most expensive region for drivers.
Sharpest Price Increases Occurred in the Northwest
States like Oregon, Alaska, and Idaho experienced the steepest year-over-year increases from 2024 to 2025. Oregon’s price of $3.82 highlights rising supply costs and tighter fuel inventories in the region.
Alaska and Idaho saw similar dynamics, driven by transportation constraints and seasonal demand.
Southern and Mountain West States See Relief
In contrast, many Southern and Mountain West states recorded modest declines in gas prices. Oklahoma now has the lowest statewide average at $2.50 per gallon, followed by Mississippi and Louisiana. Lower taxes, abundant refining infrastructure, and shorter transport routes all contribute to these reduced prices.
More By This Author:
Charted: Renters Vs. Homeowners In Every U.S. State
The Global Semiconductor Industry In One Giant Chart
All Of The World’s Gold, In One Visual


