
Charted: Renters Vs. Homeowners In Every U.S. State
(Click on image to enlarge)
Key Takeaways
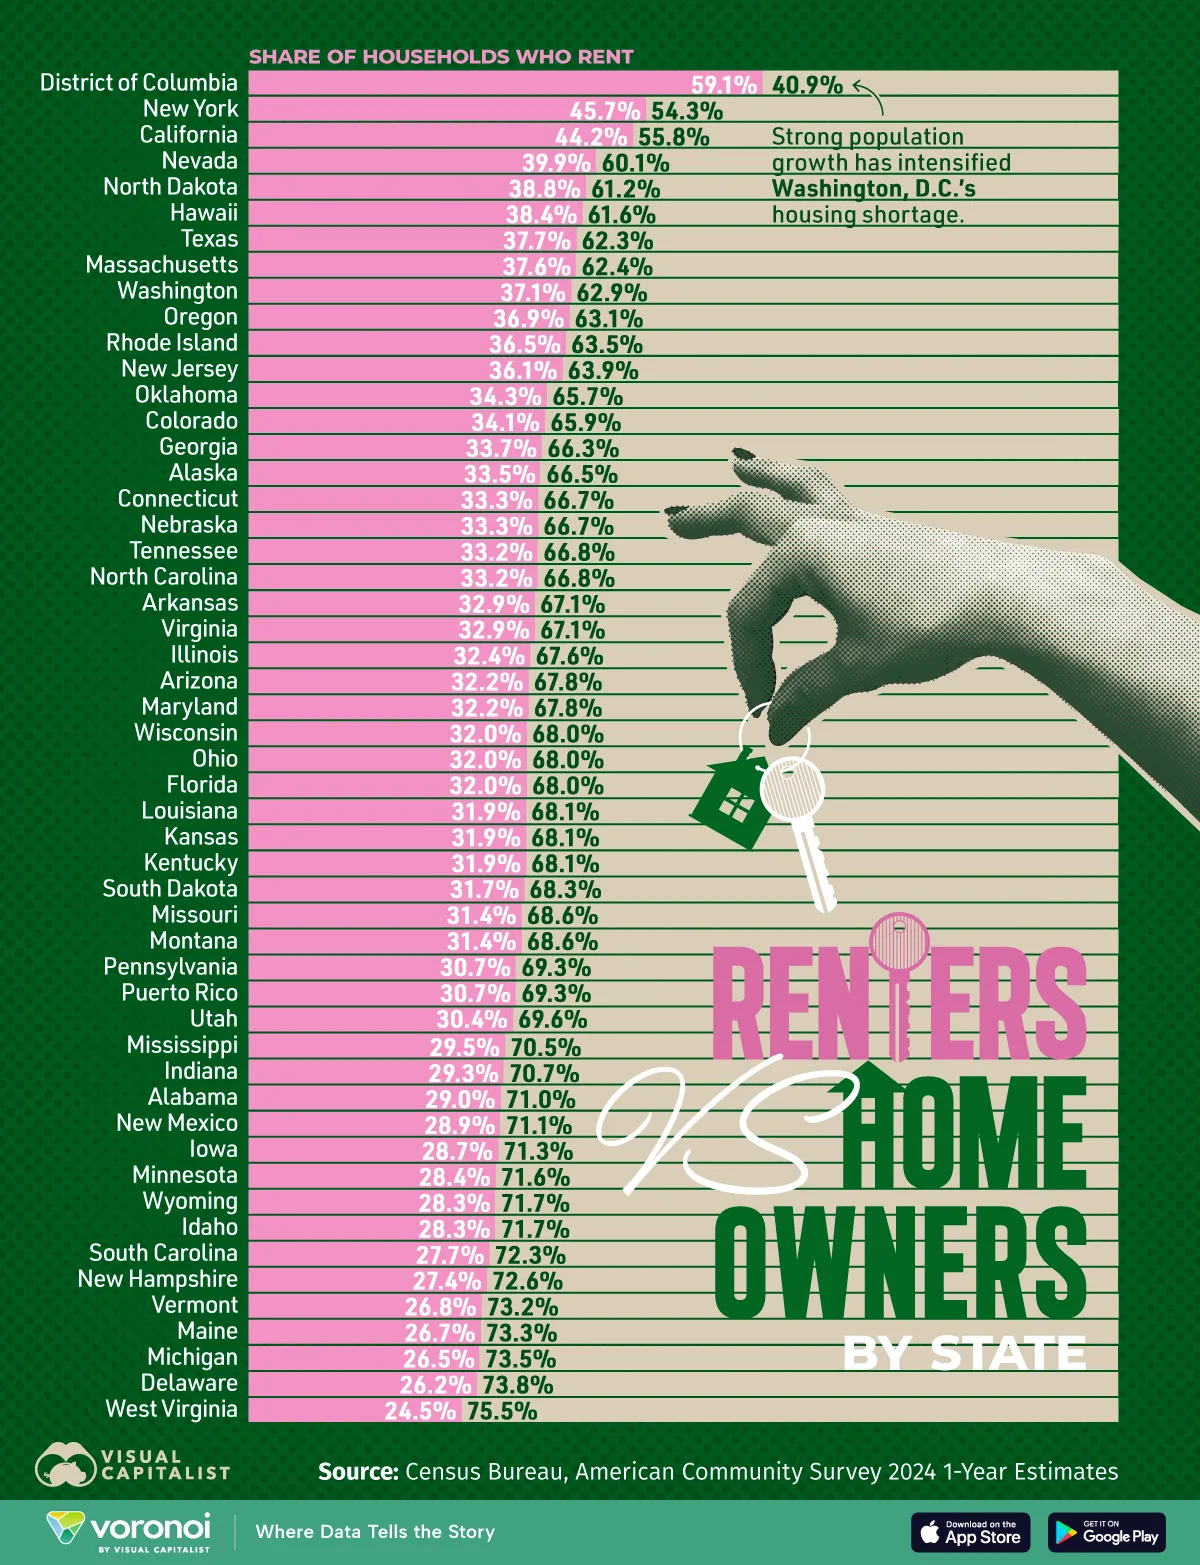
- Washington, D.C. has the highest share of renters in America, nearly double the U.S. average.
- West Virginia ranks lowest nationally, thanks to its share of affordable homes.
About one in three U.S. households rents, a ratio that has stayed surprisingly steady over the past six decades.
But with mortgage rates soaring from 2.7% in 2020 to almost 7% today—and home prices continuing to climb—the share of renters has edged up. Today, it takes $121,400 to afford a typical home, or 43% higher than the average salary.
This graphic shows the share of Americans renting versus owning by state, based on data from the U.S. Census Bureau.
A Closer Look at Renting vs. Owning in America
States with the highest share of renters are found in states with high costs of living, led by Washington, D.C. and New York.
Despite residents of Washington, D.C. having the highest average hourly wages nationally— reaching $51.30 in real terms—the number of renters far surpasses that of homeowners.
As a result of limited housing supply, it has one of the most competitive rental markets in the country. High home prices, and an influx of out-of-state residents, notably New York City and Boston, are further putting strain on renters.
Meanwhile, 45.7% of people in New York rent, ranking in second. In the Big Apple, the average monthly rent is $4,100 for a one-bedroom apartment in 2025, rising 22% in the past five years.
California (44.2%), Nevada (39.9%), and North Dakota (38.8%) round out the top five states by share of renters.
In contrast, West Virginia has the smallest share of renters across states, at just 24.5%. Supporting home ownership is its affordability, with the median home sale price standing at $225,506 in Q2 2025, significantly lower than the national median of $410,800.
More By This Author:
The Global Semiconductor Industry In One Giant Chart
All Of The World’s Gold, In One Visual
Mapped: Global Real Estate Bubble Risk In 2025


