
(Click on image to enlarge)
Despite the average energy consumption per person trending downward since 2000, energy cost still represents a significant part of American household budgets.
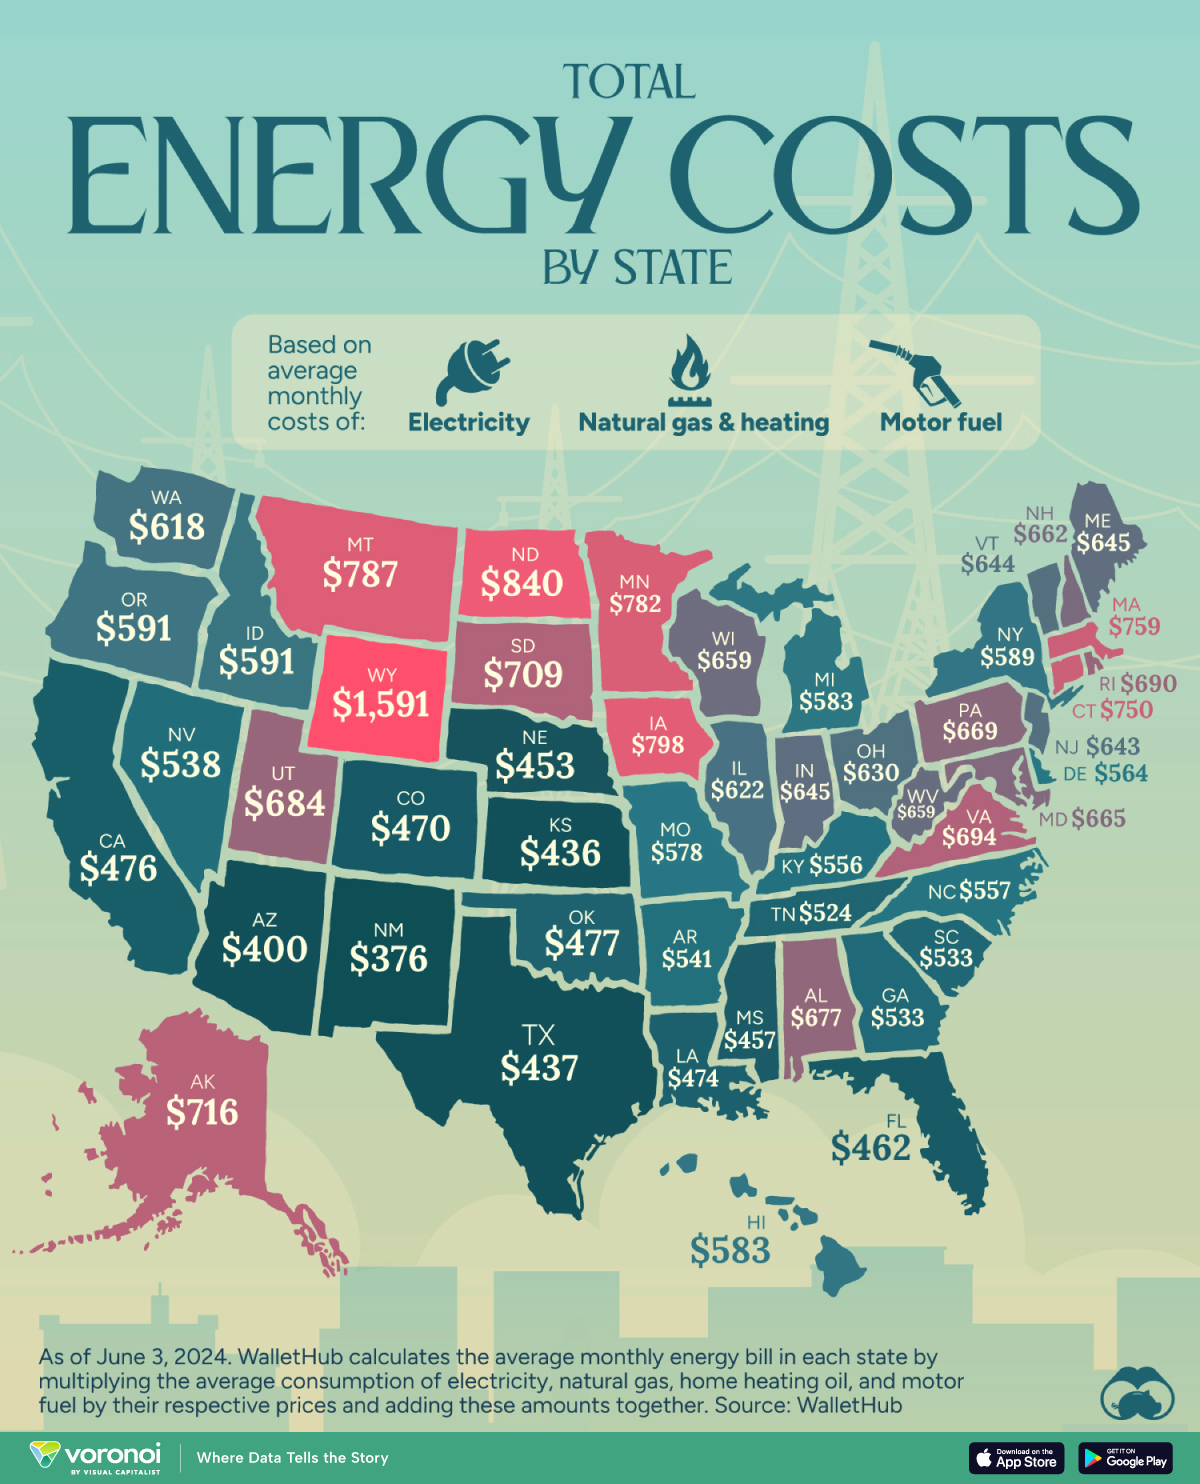
This map compares the total monthly energy bills in each of the 50 states.
Methodology
WalletHub calculated each state’s average monthly energy bill by multiplying the average consumption of electricity, natural gas, home heating oil, and motor fuel by their respective prices and adding these amounts together as of June 3, 2024.
Wyoming Leads the Ranking
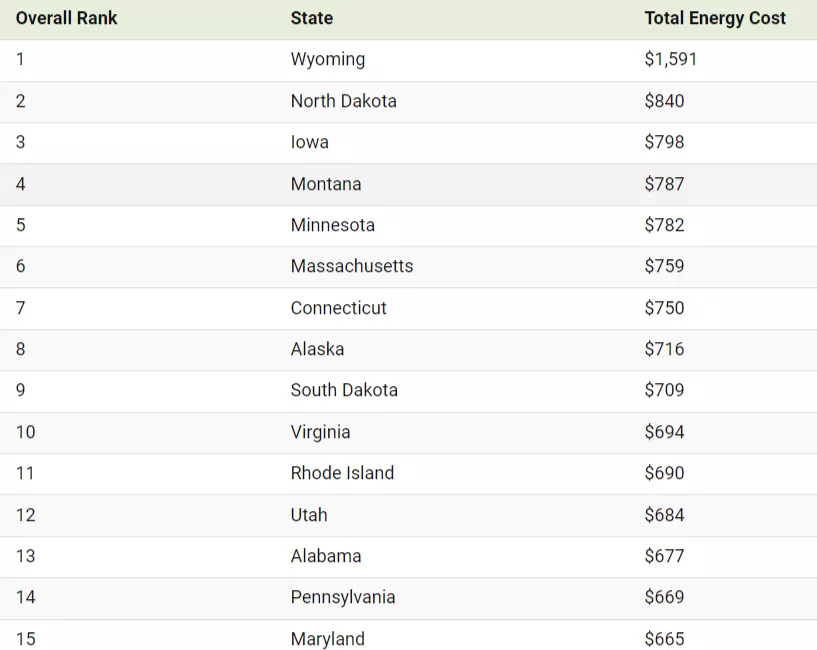
Wyoming has the highest energy costs in 2024.
The state has the highest gas and residential oil consumption per capita, and residents’ average monthly energy bill is $1,591. Among many factors, the state also has extremely cold winters, and many residents live in remote areas with limited heating options.
North Dakota, another state with harsh winters, has the second-most expensive average monthly energy bill, at $840. Interestingly, aside from heating oil, energy is relatively inexpensive in the state. It’s just high usage that drives up monthly bills.
Iowa is the third-most energy-expensive state, with residents’ average monthly energy bill costing $798, about half of the cost in Wyoming.
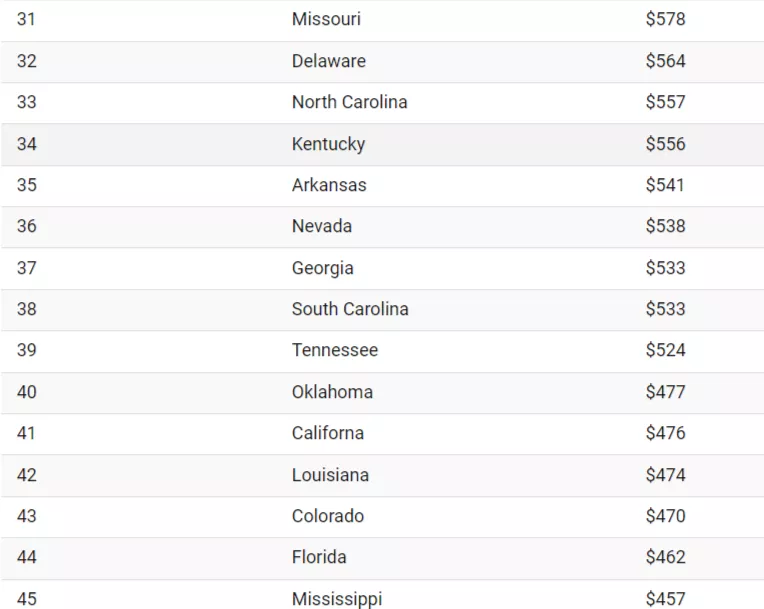

Meanwhile, New Mexico is the state with the lowest energy costs, at $376.
According to the U.S. Energy Information Administration, the highest energy consumption of the year is recorded during summer in July, followed by August.
More By This Author:
Charted: The Eight U.S. States With Population Declines In 2023Charted: 776 Million Tonnes Of Rice Production By Country
Visualizing The Growth Of U.S. Sports Betting


Comments
Log in or sign up to join the conversation.