
(Click on image to enlarge)
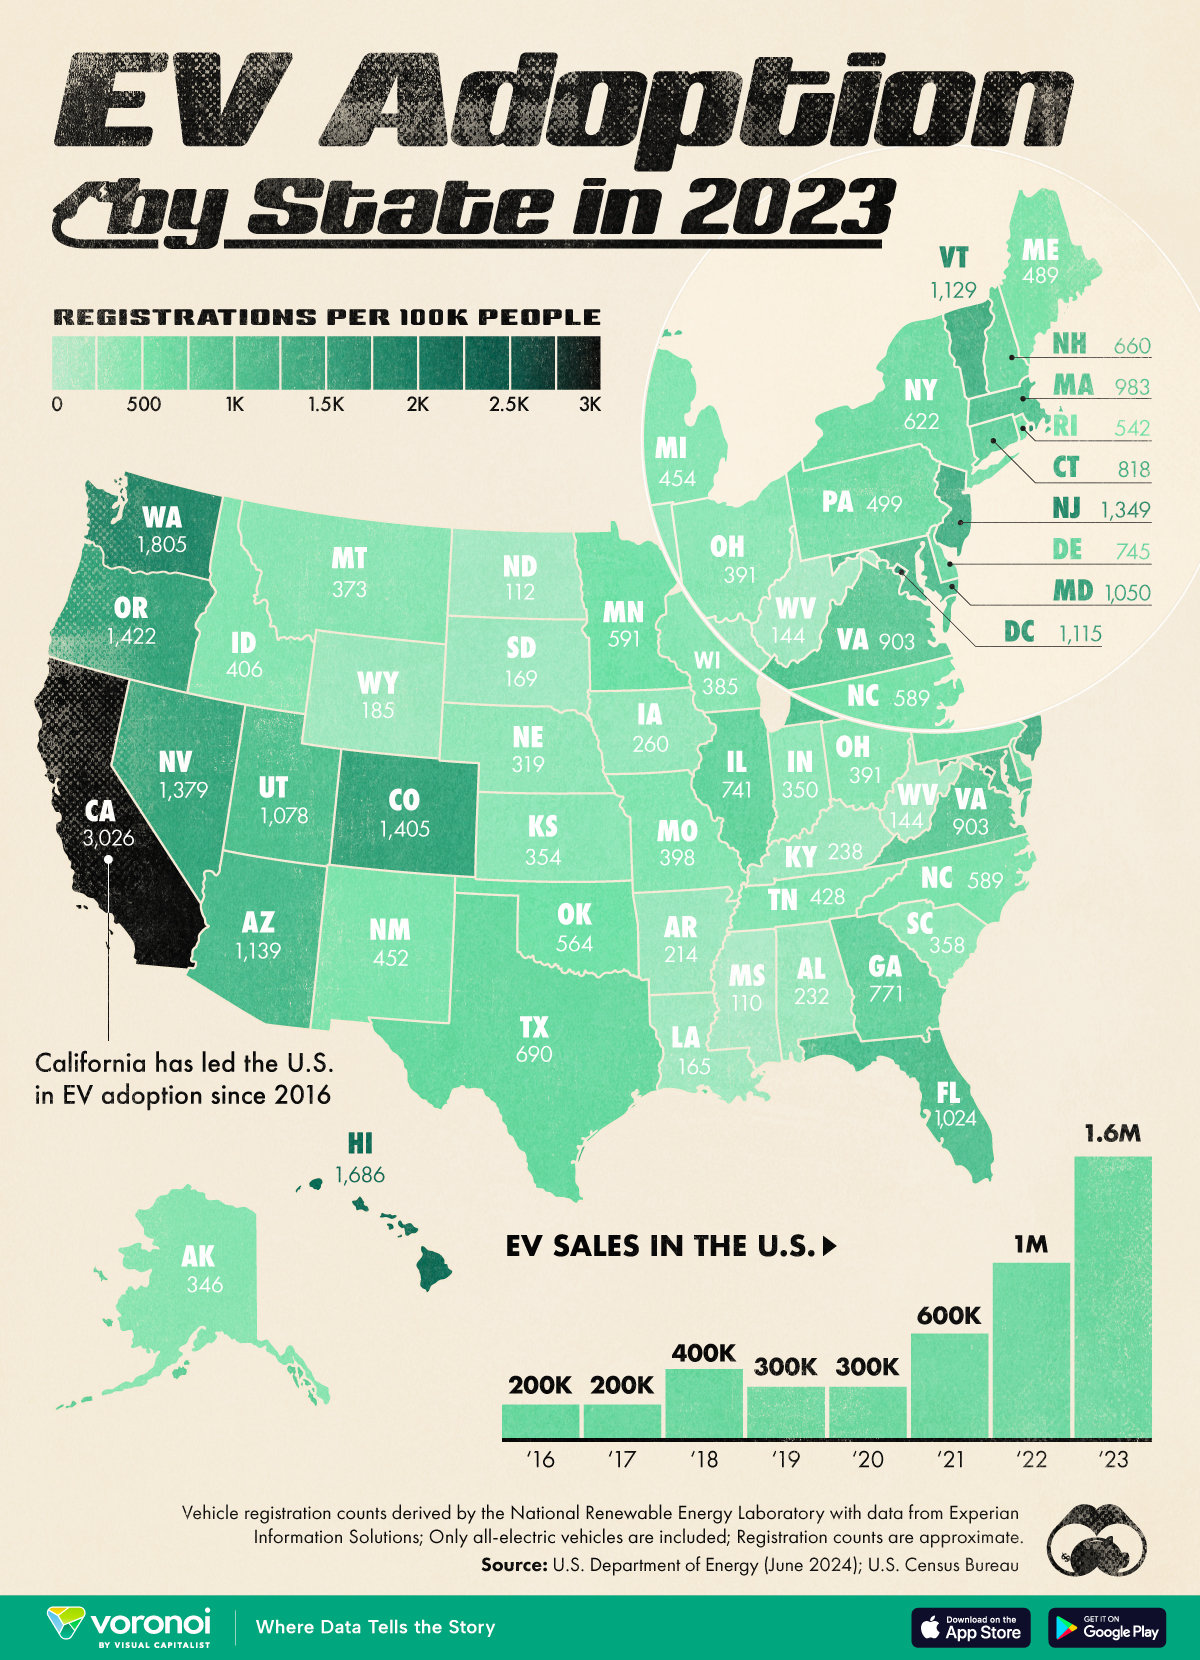
In 2023, sales of electric vehicles (EVs) passed the 1.6 million mark.
To visualize where EVs are the most popular, this map shows the number of registered EVs per 100,000 people by state as of June 2024. The vehicle registration data is sourced from the U.S. Department of Energy, while population data is from the U.S. Census Bureau.
Only all-electric vehicles are included on the map.
California Leads EV Adoption
California has the highest number of electric vehicles, with 1.1 million. Florida follows with 231,000 EVs, and Texas ranks third with 210,000.
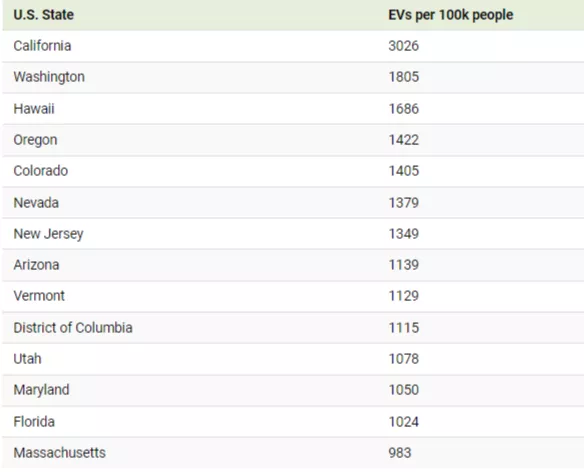
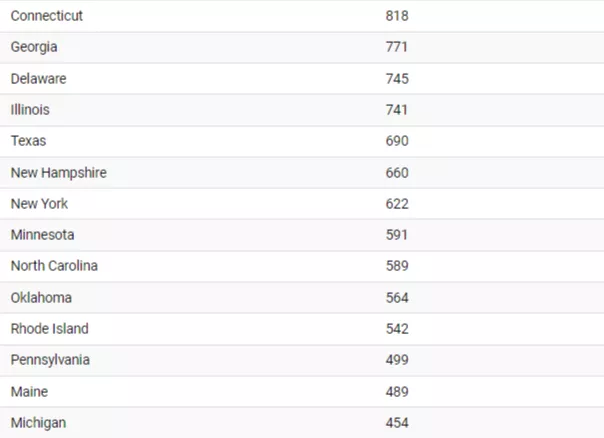
When considering EVs per 100,000 people, California also leads with 3,026 cars per 100,000 people, followed by Washington, Hawaii, and Oregon.
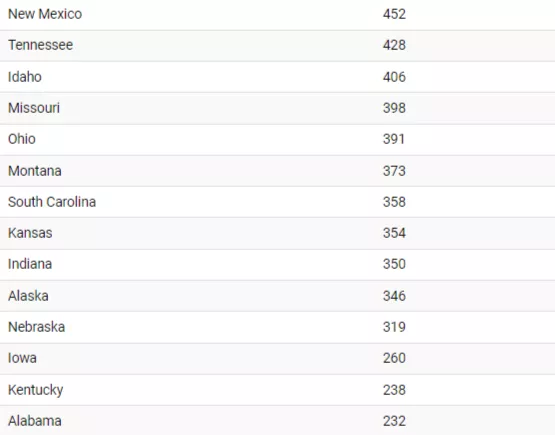

Mississippi has the fewest electric vehicles proportionally, with only 110 EVs per 100,000 people. North Dakota has a similar lack of EVs, with 112 per 100,000 people in the state.
Additionally, California has the highest number of EV charging stations, with over 15,000, making up 29% of all charging stations in America. As of 2022, the Golden State had nearly double the number of chargers compared to the next three states combined: New York, Florida, and Texas.
If you liked this post, check out Ranked: The Top 10 EV Battery Manufacturers in 2023. In this graphic we rank the top 10 EV battery manufacturers by total battery deployment (measured in megawatt-hours) in 2023.
More By This Author:
The Top 10 Countries By Gold Reserves In 2024Mapped: Global Wealth By Region (2023-2028F)
Visualizing The Growth Of Chinese Copper Miners


Comments
Log in or sign up to join the conversation.