
(Click on image to enlarge)

China, with its huge manufacturing sector, is by far the biggest consumer of copper.
Currently, 70% of copper used in China is imported. As a result, the country has invested heavily in copper mines to secure future supply.
This graphic uses exclusive data from our partner, Benchmark Mineral Intelligence, to compare copper output from the top three global producers with Chinese miners. Since some of the mining operations have shared ownership, this graphic takes into consideration only the portion of production relative to the company’s stake in each mine.
Chinese Miners Set to Overtake Major Producers by 2025
In 2010, Chinese miners produced a total of 1.2 million tonnes of copper. In that same year, the top producer, Chilean state miner Codelco, produced 1.8 million tonnes, while the world’s largest miner and second-largest copper producer, BHP, produced 1 million tonnes.
Over the years, however, Chinese output has surged while major miners have faced challenges. In 2023, Codelco’s production fell to its lowest level in a quarter of a century due to operational problems and project delays.
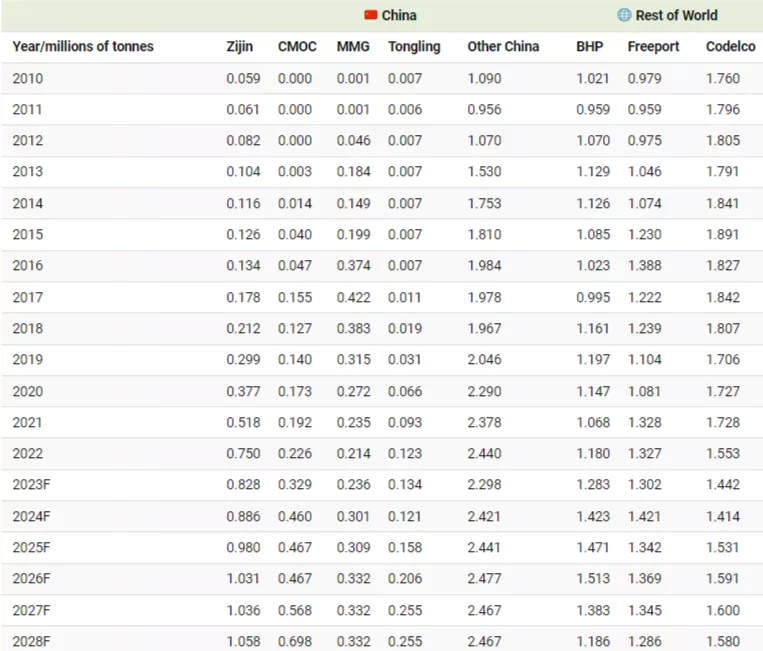
Meanwhile, China’s biggest copper producer, Zijin Mining, saw its production rise from 0.059 million tonnes in 2010 to 0.8 million tonnes last year.
Combined, Chinese companies produced 3.2 million tonnes of copper in 2023, compared to the combined production of 4 million tonnes by Codelco, Freeport-McMoRan (the biggest copper producer in the U.S.), and BHP.
According to Benchmark Mineral Intelligence data, Chinese miners are forecasted to surpass the three top producers in 2025, with a combined production of 4.4 million tonnes compared to 4.3 million tonnes from Codelco, BHP, and Freeport.
More By This Author:
Visualizing the Rising Cost of Government DebtCharted: The Surging Value Of The Magnificent Seven (2000-2024)
Visualized: GDP Growth Projections For Key Economies (2024-2025)


Comments
Log in or sign up to join the conversation.