

Image Source: Pixabay
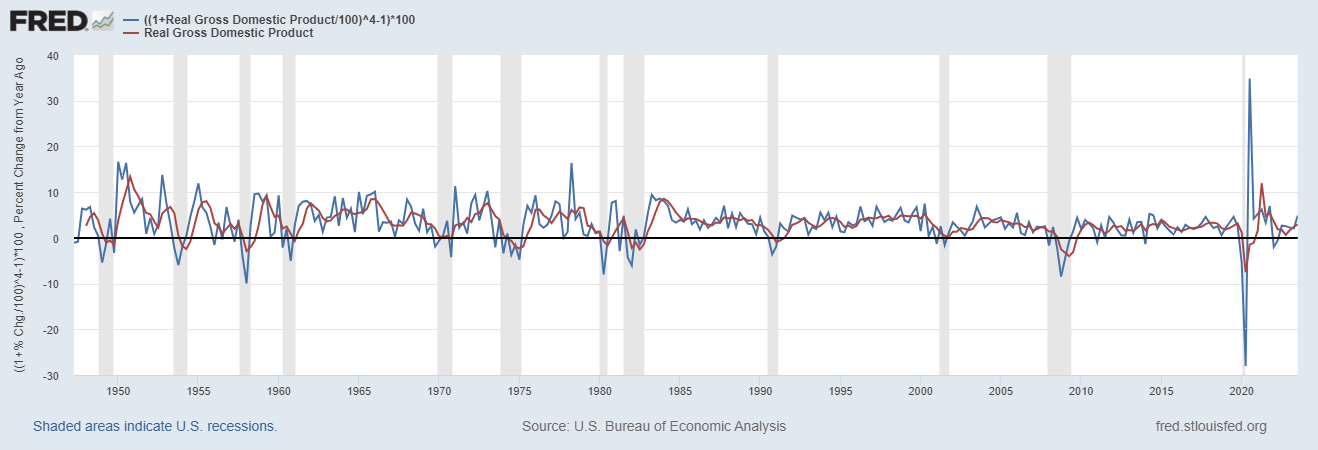
GDP came in hotter than expected. Sequentially, Real GDP grew 4.9%. To say it another way, the annualized growth rate of the quarter-over-quarter change in GDP, or (Q32023/Q22023)^4. The reason to look at it on a QoQ annualized basis is that you would see a problem in the economy sooner than the YoY numbers. The YoY annual rate of change or Q32023/Q32022 is up 2.93% which is better growth for 3 quarters in a row after we got slower annualized growth every quarter in 2022.
GDP = Consumption + Government + Investment + NetExports
Here’s the equation for this quarter’s growth.
$560B=$315B + $104B + $119B + $22B
Let’s do a quick look into the 4 factors. I’m going to save our Government for last.
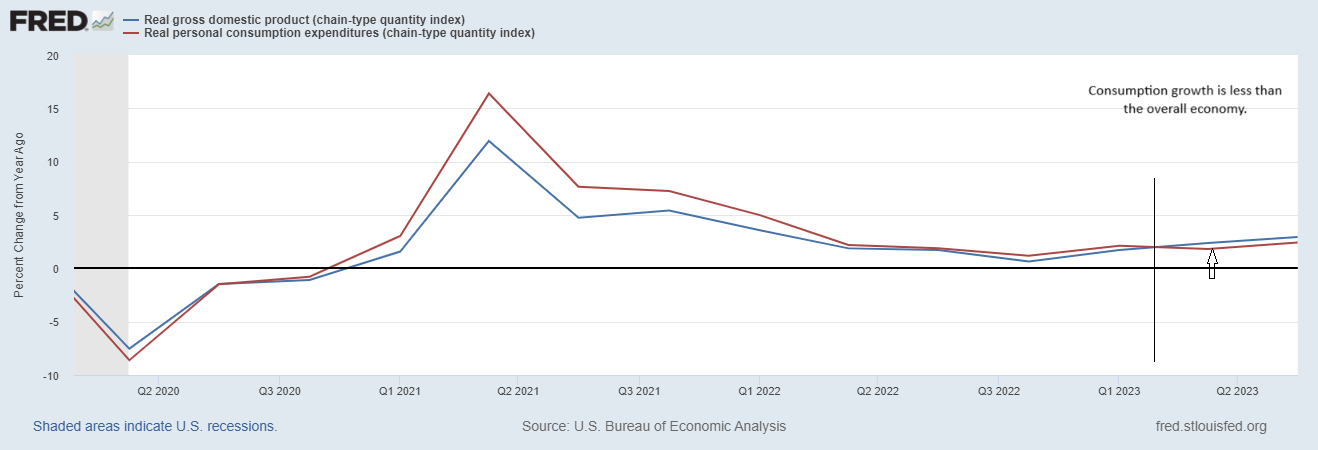
Consumption is the largest part of the equation. The consumer had a good quarter, growing 7% annualized versus Q2. Of the $315B they added, $86B was goods and $219B was services. That’s a lot of Taylor Swift concert tickets, and accompanying flights and expensive hotel rooms!
From a broader perspective, consumption is growing at 2.4% annually, a relative drag on an economy growing 2.93%. The consumer was leading the economy for 10 quarters in a row coming out of the depth of the pandemic uncertainty in Q2 2020. Consumer spending growth has now been less than the economy overall for 2 quarters in a row. 2.4% is by no means bad and it’s nice to see a rebound from the 1.8% growth in Q2 2023. But the Consumer is not leading this charge on a relative basis.
Investment
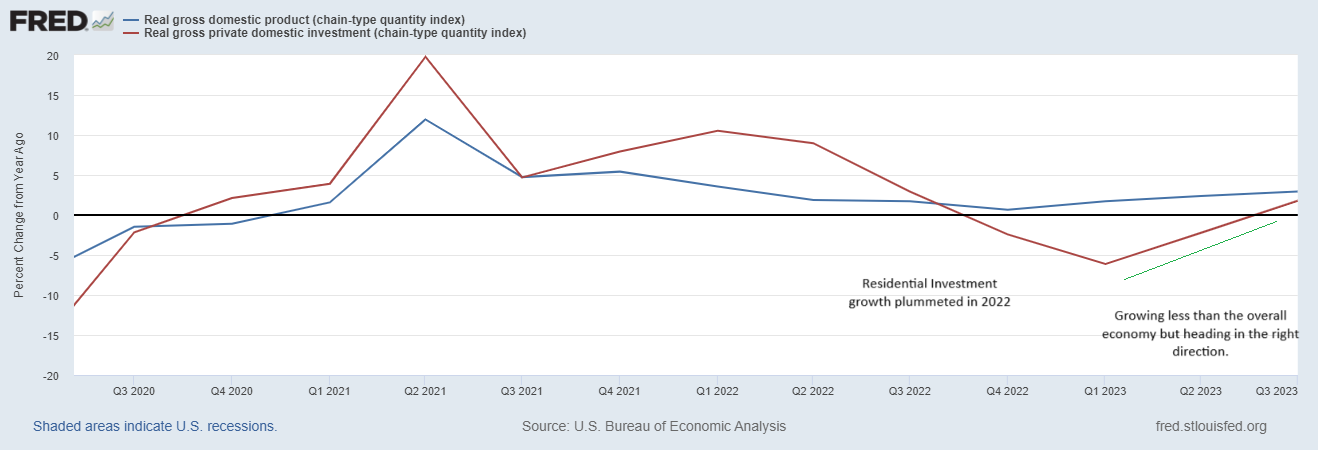
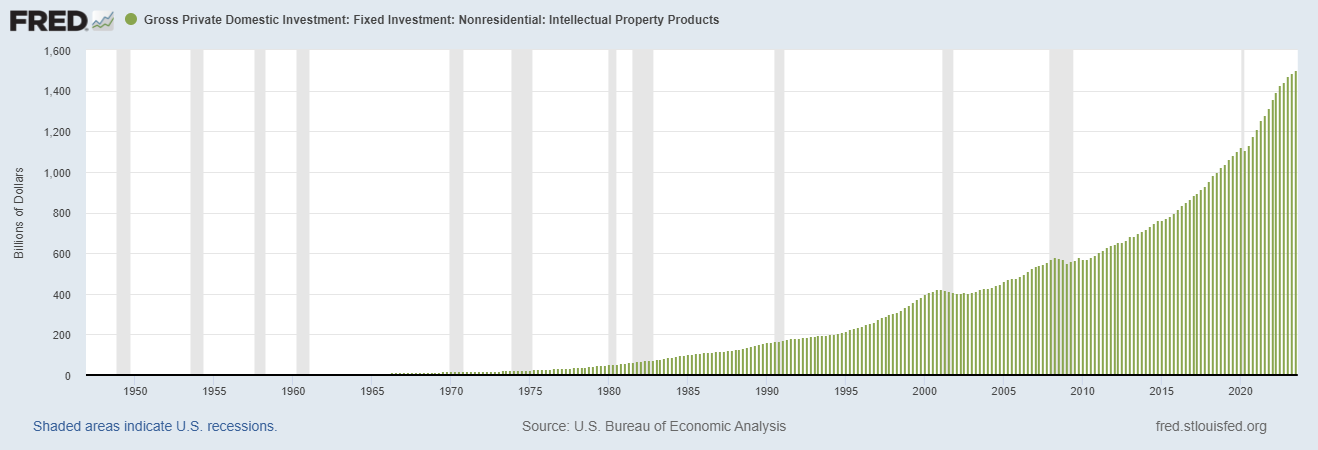
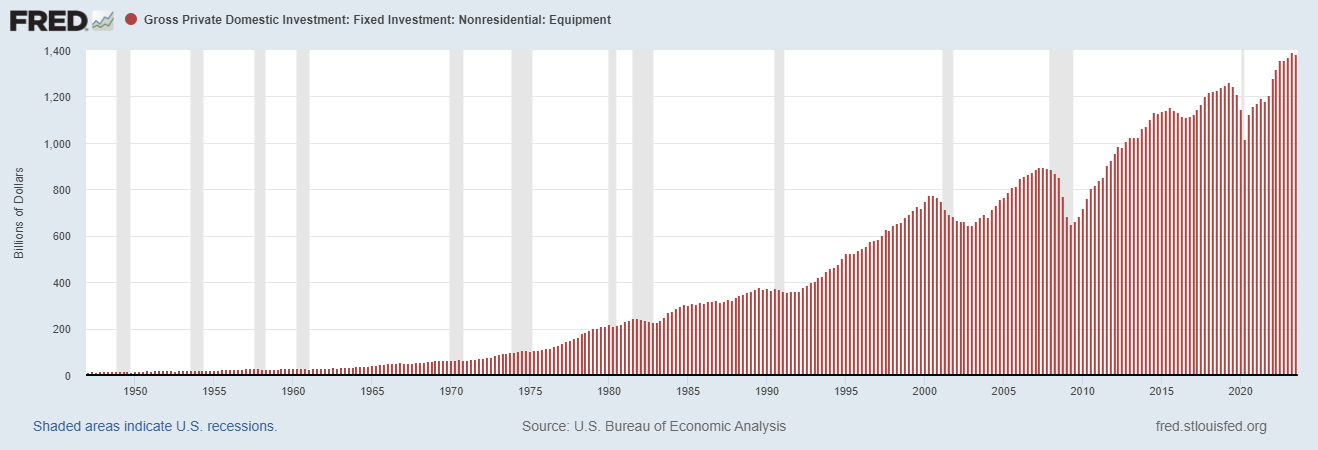
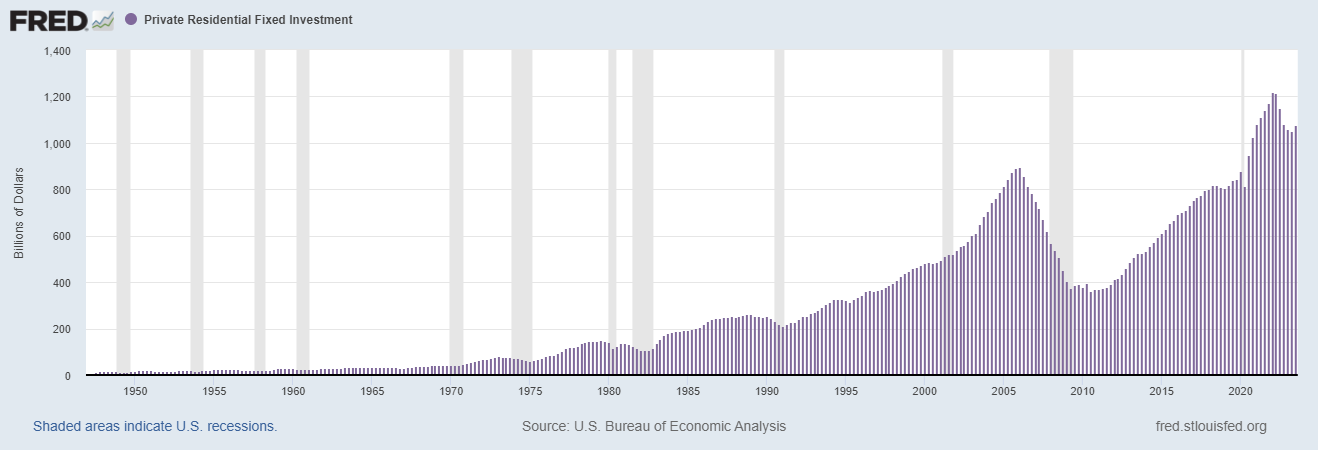
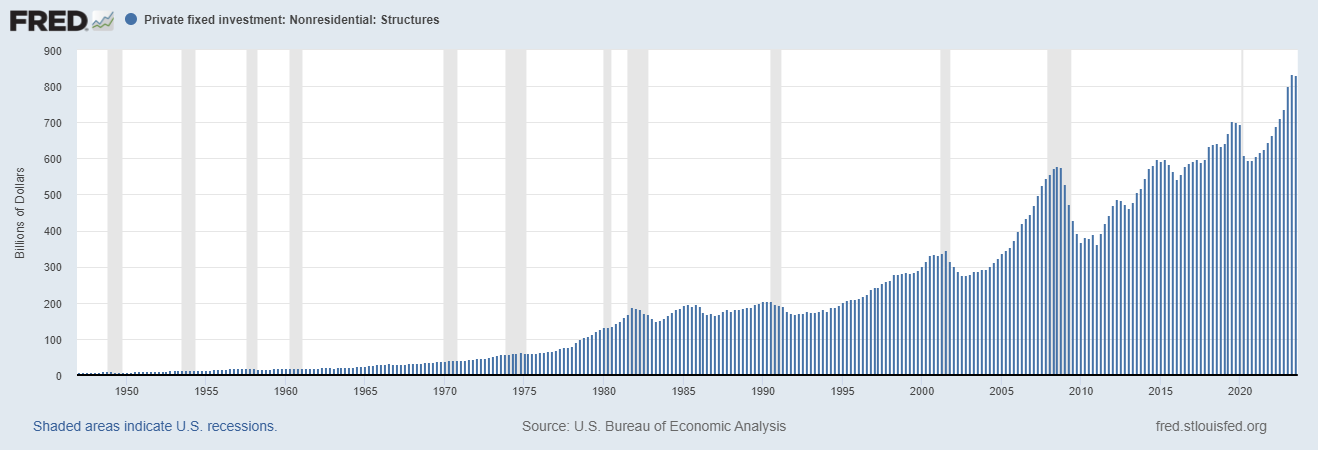
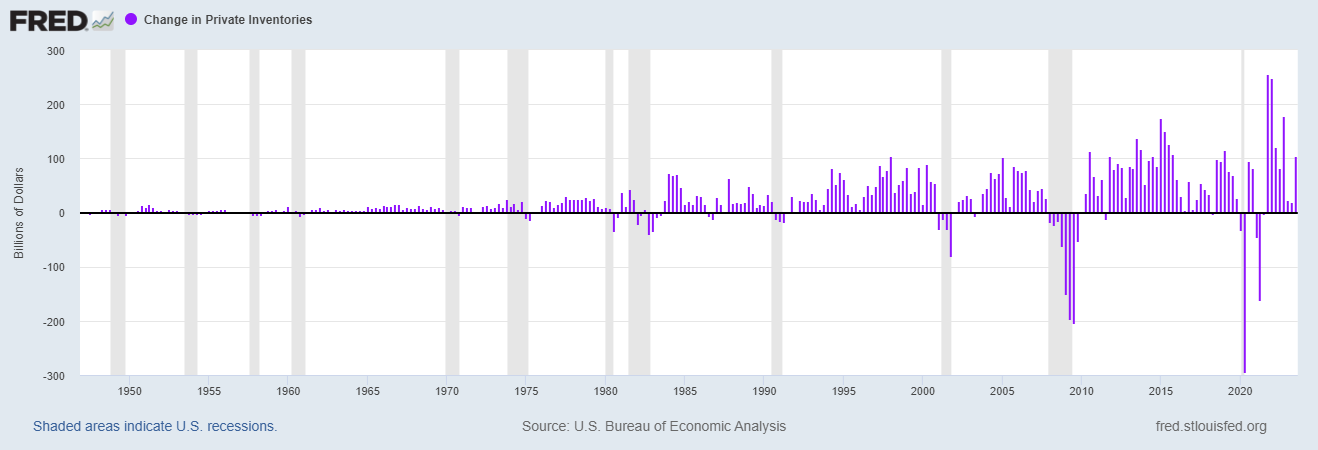
For the quarter, the biggest contributor to the $119B of investment added in the economy was an increase in private inventories of $87B. This series has been extremely volatile since the pandemic (supply chain issues). Overall, it is a small number (fluctuating around 0), but will be the determining factor depending on the swings from quarter to quarter. Residential real estate investment contributed $20B. This was nice to see, because residential investment had fallen 5 quarters in a row after the surge during the pandemic. Intellectual property added $15B. Non-residential structures were flat after contributing quite nicely for 10 quarters in a row. Investment in equipment was a net negative after being a positive contributor in 11 of the last 12 quarters. Overall investment looks healthier than it did in Q1. Intellectual property is the darling of the last few years, amazing. Overall on a YoY basis, Investment growth has been less than the economy overall, though looking at the trajectory, that may change in a quarter or 2.
Here are the different categories of investment in order based on how much money is spent each quarter.
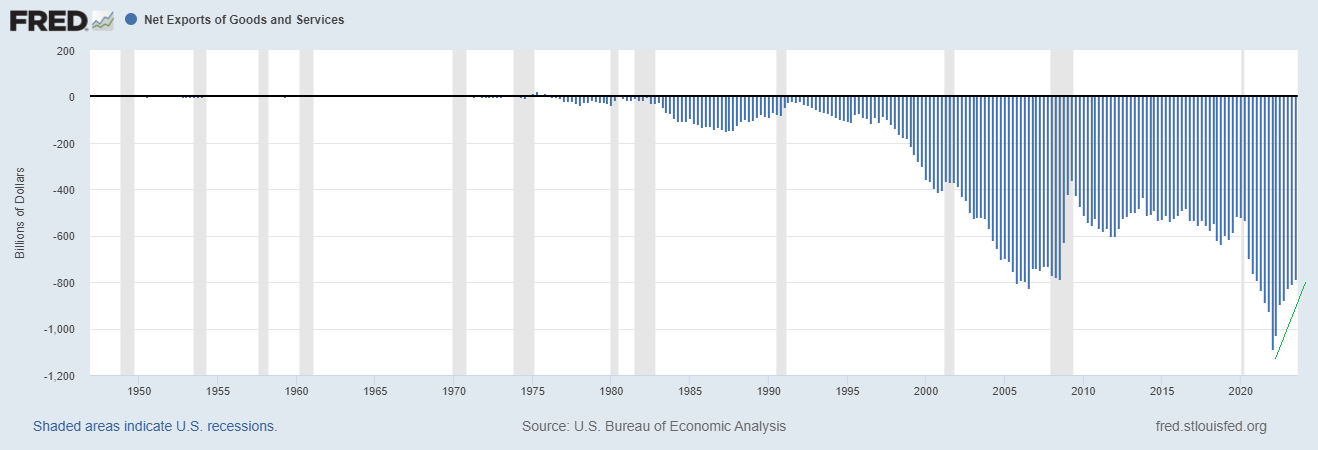
Net Exports
The trade deficit was less negative by $22B which added to GDP. Net exports has been slowing improving since the record trade deficit in Q1 2022. Looking at trade’s relative performance, we have improved the deficit by $108B over the past year. That is a 13% improvement in this factor. So on a relative basis, this has been a strong growth contributor.
Government
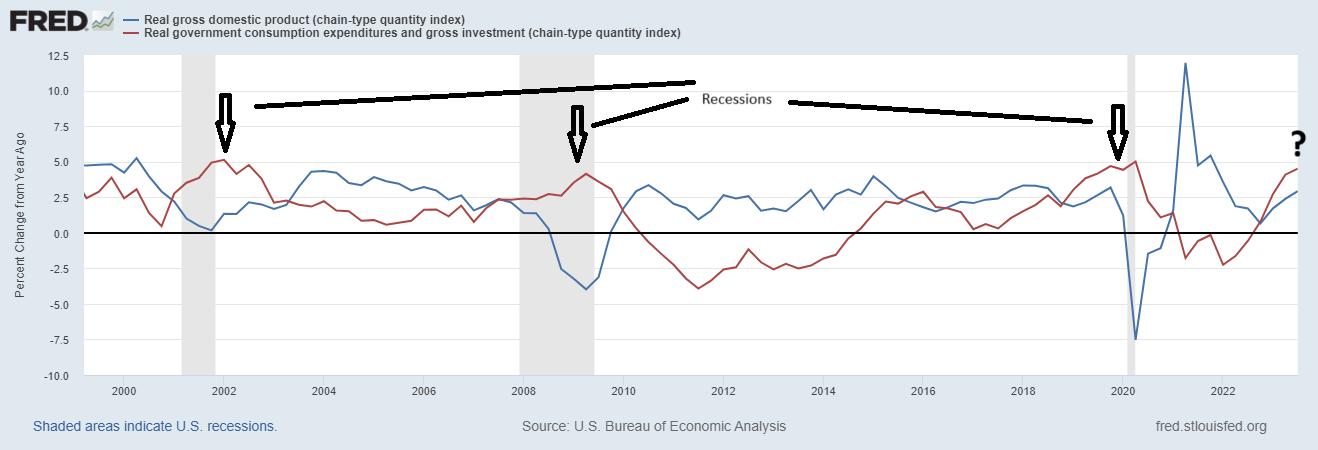
The growth of real government spending in the last year has been 4.5% in an economy that is growing 2.9%. Historically (Keynesian Economics), the government spends more during economic downturns to smooth the bumps in the road of economic cycles. Why?? When the economy is growing at close to 3% is government spending growth 4.5%. Are they trying to stoke the inflation by increasing demand?
Let’s look at what’s going on.
- State and Local Governments are the biggest spenders, roughly 66% bigger than Federal spending. State and local governments spending increased 3.9%, 1% more than the economy as a whole. Much of this is salaries, perhaps some is delayed infrastructure spending.
- Federal Defense Spending is up 4.9% from a year ago a full 2% higher than the economy at large. About 3.5 cents of every dollar spent in the economy is on defense.
- Real Federal Non-Defense Spending is up a whopping 6.25% year over year. They have increased their spending 260% more than the people. What are they possibly spending that money on?
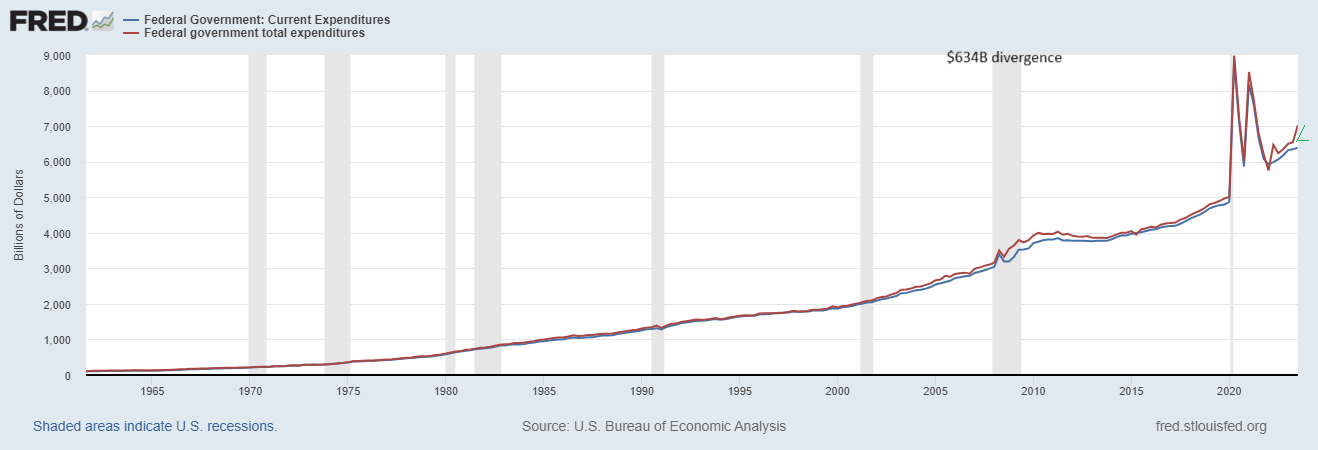
Current government expenditures went up about 5.4% or about $328B. But total government expenditures rose a whopping 12.75% or $790B. There is currently a gaping $634B difference between current government spending and total government spending. Where’d the other $462B come from? $349B comes from a category called capital transfer payments. These are generally described as subsidies, grants, and relief. Some of these were imbedded in the Inflation Reduction Act to incentivize green energy. The Employee Retention Credit being marketed on the radio would be part of this. Student loan forgiveness is likely in here among other things.
![]()
More By This Author:
Macro: Inflation Measures PCE And GDP DeflatorMacro: Initial Unemployment Claims
Macro: Durable Goods New Orders

Comments
Log in or sign up to join the conversation.