
Wall street cheered the fact that we added fewer jobs (150,000) than expected (179,000) in October. This was a welcome relief after the hot September number that was revised down from 336,000 to 279,000.
The Goods economy actually lost 11,000 jobs. The culprit here was motor vehicles and parts which was -33,000 on the month.
The Services economy gained 110,000 jobs. 77,000 were in Health Care and Social Services. 10,000 were added to perming arts and spectator sports. And another 10,000 were added in amusement, gambling and recreation.
The public sector added 51,000 jobs. 38,000 for local governments, 10,000 at the state level and the balance to the Fed.
The major Wall St narrative at play is that a combination of a lower revision and a below expectations print in October is enough softness that it means the Fed is done hiking rates. This week’s positive earnings and liquidity infused rally continues.
Looking out in the future, we will hope that the downward trend abates and the soft landing might happen. But we must be wary as employment is a lagging indicator and further deterioration becomes a bigger concern than whether or not the Fed hikes one more time.
(Click on image to enlarge)
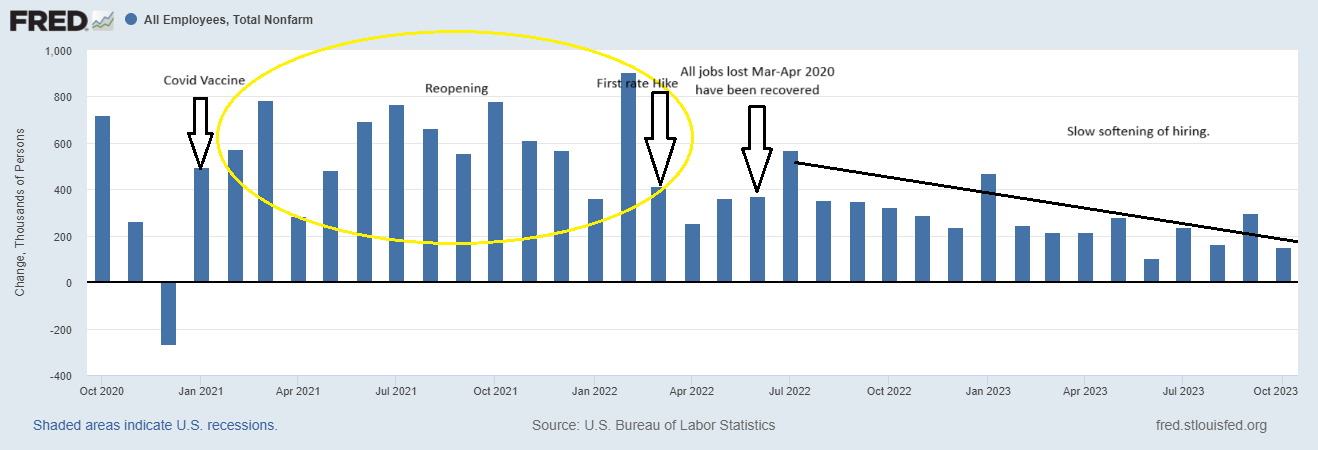
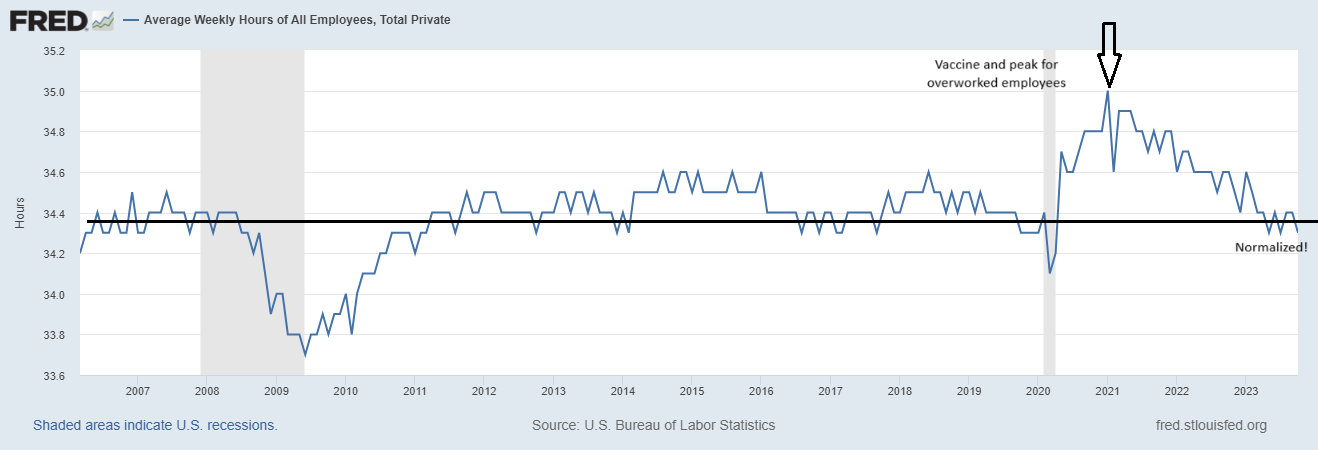
Looking back at the past 3 years, there was a surge of hiring after the first vaccines were administered in Jan 2021. By June 2022 we had gained back all the jobs lost in the first part of pandemic. The Federal Reserve started hiking rates in March 2022 and the labor market has slowly cooled since. As we know, workers were taxed as many had not returned to the workforce. This was likely a factor or catalyst to union contract negotiations. Avg weekly hours worked peaked in Jan 2021 at 35 hr/wk and has now normalized to 34.3-34.4 hrs/wk,
(Click on image to enlarge)
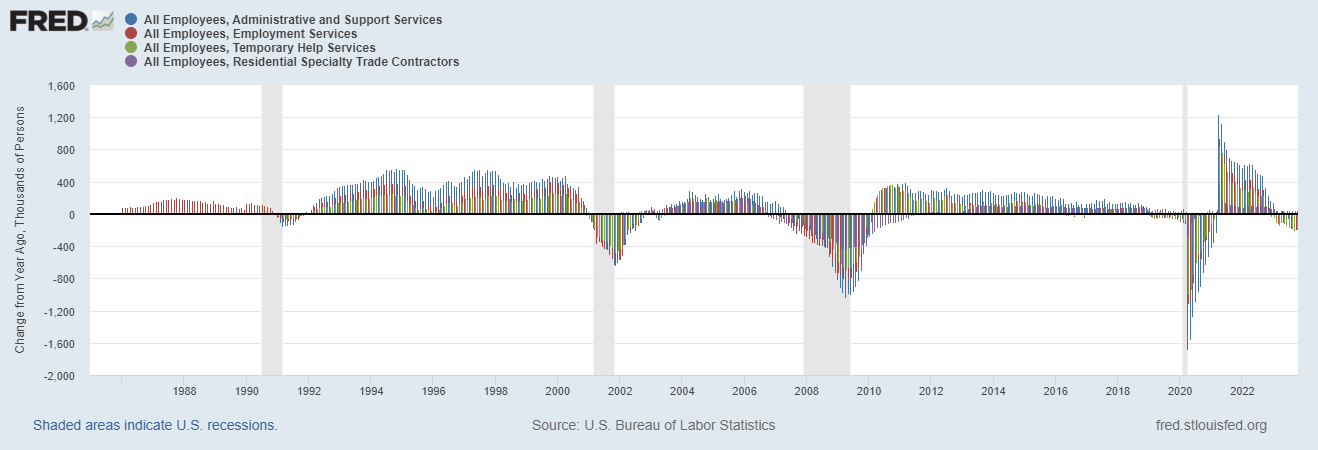
To reiterate being wary, as a lagging indicator we want to be vigilant about watching for weakness. With people re-entering the workforce, the unemployment rate has risen from a low 3.4% to 3.9%. Historically red flags are a rise of 1% in the unemployment rate and/or employment growth below 1%. Employment is currently growing at 1.89% and the unemployment rate has risen by .5%, so our light may be turning yellow. I also have what I like to call the canary in the coal mine employment graph. It tracks the change in employment in 4 areas I believe to be the first places people loose their jobs. Again, a faint yellow light.
(Click on image to enlarge)
More By This Author:
Retirement Account Contribution Limits For 2024Macro: Challenger Job Cuts — Improvement Throughout The Year
Macro: Oct S&P Final And ISM PMI


Comments
Log in or sign up to join the conversation.