
We have found that the correlation relationships between various types of credit and inflation are variable over time. So far, the kinds of credit studied are government deficit spending,1,6 consumer credit,2 mortgage debt,3 nonfinancial corporate credit,4 and financial sector debt.5 Here, we examine the relationship between the total money supply (M2) and Consumer Price Index (CPI) inflation.7

Introduction
The M2 money supply has been reported monthly since January 1959.8 This enables the correlation between quarterly changes of M2 and CPI inflation with quarterly timeline offsets. This way, we produce results that can be compared directly with those for the other analyses in this series.2–6
The hypothesis we are testing is that inflation depends on M2 in a linear manner, expressed in the following equation:
I = mS + b
where
I = Change in CPI (the Consumer Price Index)
S = Change in M2
The two constants, m and b, define the relationship of y, the dependent variable, to x, the independent variable. By writing the relationship this way, we imply that CPI (y) depends on M2 (x). But this is a mere formality because the equation can be rearranged:
S = m’ I + b’
where
m’ = 1/m
b’ = -b/m
This equivalent equation implies that M2 depends on inflation without affecting results and conclusions.
Data
A definition of inflationary periods was made in the original federal deficit spending and consumer inflation study.1 The inflation time series has periods of inflationary surges, deflationary surges, and years when inflation/disinflation/deflation have trends with <4% change uninterrupted by countertrend moves >1.5%. The three types of inflationary periods from 1952-2022 are in Tables 1-3. For the definition of the various periods, see “Government Spending and Inflation: Reprise and Summary”.1
Table 1. Periods of Significant Increases of Inflation 1952-2022
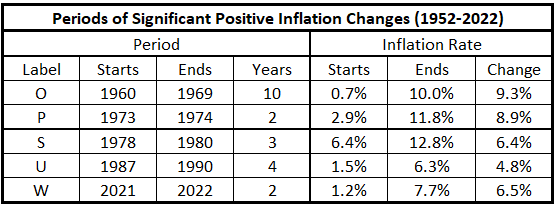
Table 2. Periods of Significant Decreases of Inflation 1952-2022
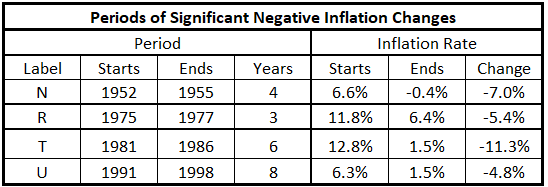
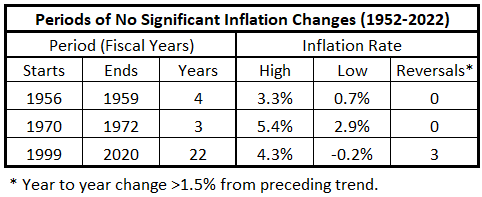
Table 3. Periods without Significant Inflation Trends 1952-2022
Inflation Measured Quarterly
Above, the definition of inflation is done annually. In this study, we use quarterly inflation data; see Appendix 2. Previous work,1 using annual data, produced the inflation time series graph shown in Figure 1.
Figure 1. CPI Annual Inflation 1914-2022 with Significant Changes in Inflation Noted
(Each letter identifies the end of a significant move.)
![]()
The data in Figure 1 produced Tables 1-3.
Figure 2 shows the rolling four-quarter inflation using the quarterly data used in this study. This results in four times as many data points for 12 months of inflation over the same 109 years.
Figure 2. CPI Rolling Four Quarter Inflation 1914-2022
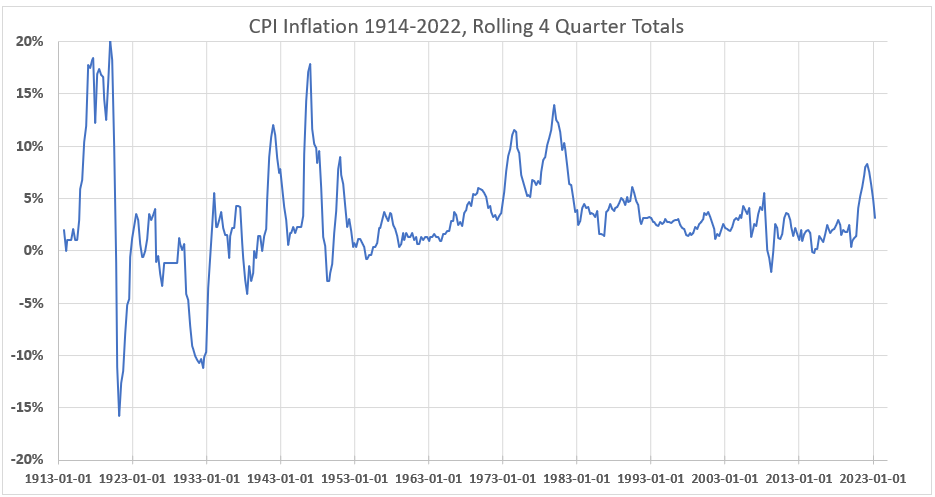
There is much more structure in Figure 2 than in Figure 1. This may reflect noise in the Figure 2 data or be real information. However, the only area where this question may have importance could be the three peaks from 3Q 1917 to 1Q 1920. In Figure 1, this time period shows only a single peak with a shoulder approaching 1920. However, addressing this question has no bearing on the current study, which covers the 63 years 1959-2023.
Figure 3 displays the inflation data for the study period 1952-2022.
Figure 3. CPI Rolling Four Quarter Inflation 1952-2022 with Significant Changes in Inflation Noted
(Each letter identifies the end of a significant move. An * identifies the end of an insignificant time period.)

A summary of the data in Figure 3 is in Table 4.
Table 4. Timeline of Inflation Data 1952-2022
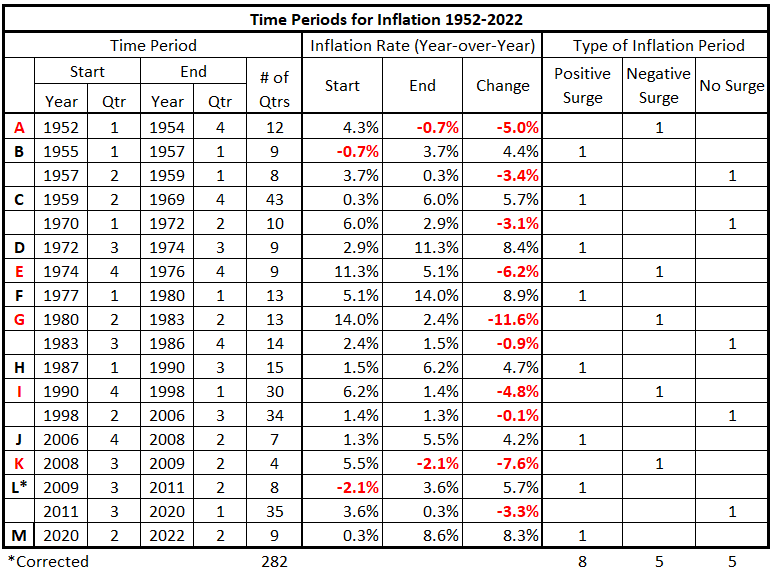
The quarterly data displays more information than the yearly data used previously.
- Table 4 shows eight periods with positive inflation surges over the 70-year period, while the previous study defined only 5.
- There are five negative inflation surges in Table 4, one more than in the previous study.
- Table 4 also shows five time periods with insignificant inflation changes, while the previous study had only three.
- Significant inflationary periods are identified here for 2006-08 and 2009-11 with the quarterly data. A significant deflationary period was identified for 2008-09.
- There were 3 1/2 years 1983-86 with no significant inflation changes not identified previously.
Note: 1999-2020 was previously identified as a 22-year period with no significant inflationary trends. The quarterly data found two significant inflationary trends and one significant deflationary trend within the interval.
Using the quarterly data gives a better resolution of inflationary and deflationary periods than was obtained with the annualized data. Whether or not this is useful remains to be seen with further analysis.
Comparing M2 Money Supply Growth to Inflation
Figure 4 from Wikipedia shows annualized data ( rolling four-quarter moving averages) for inflation and M2 from 1960 to 2022.
Figure 4. M2 and CPI Changes Annualized Quarterly from 1960 to 2022.
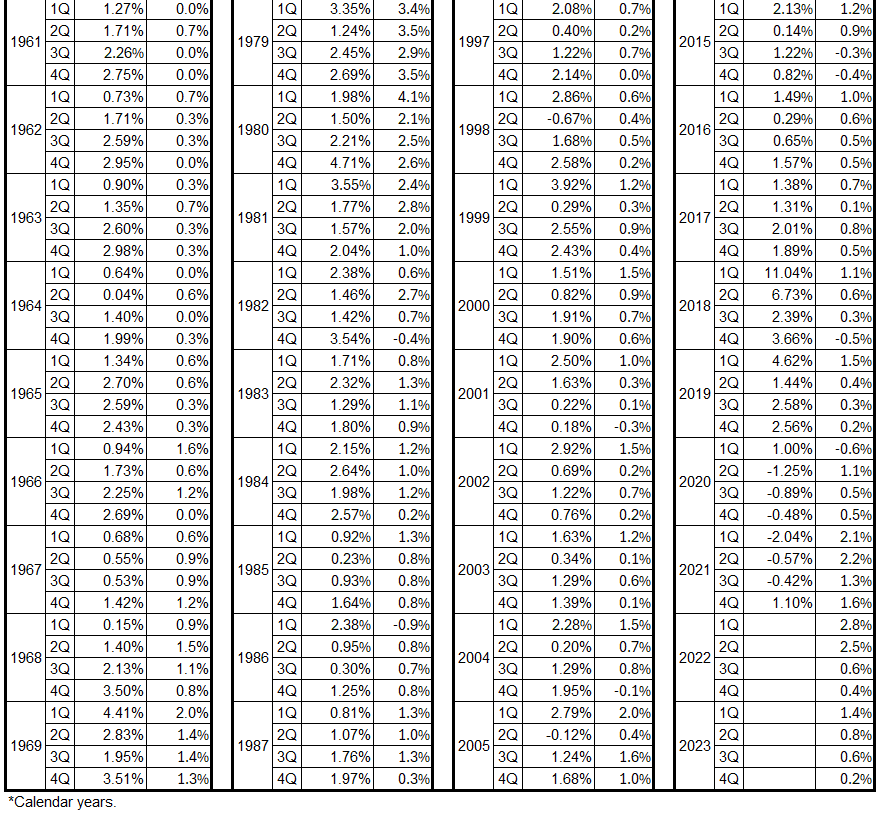
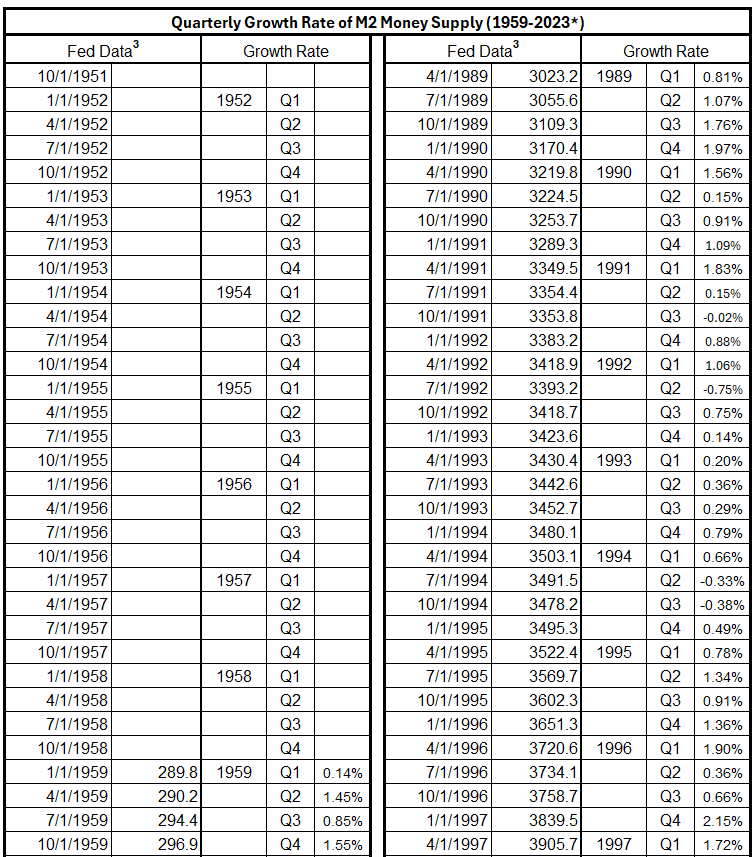
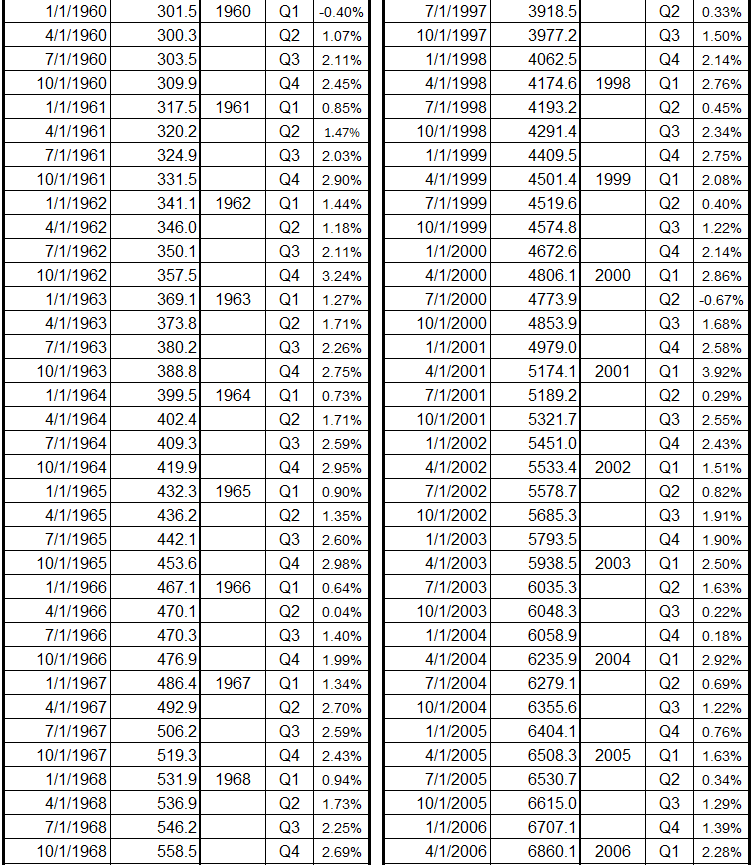
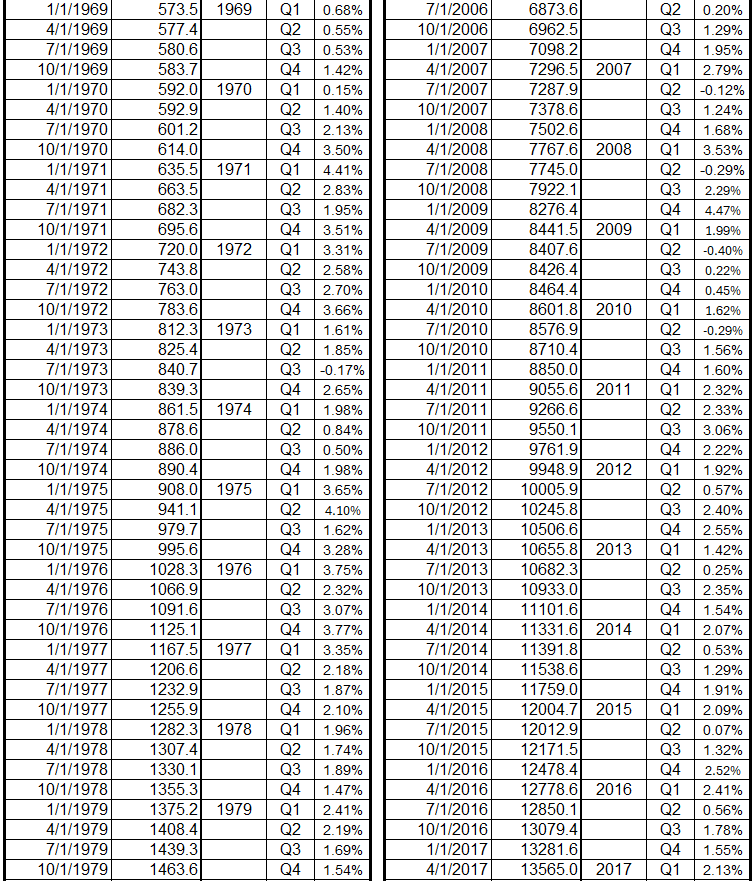
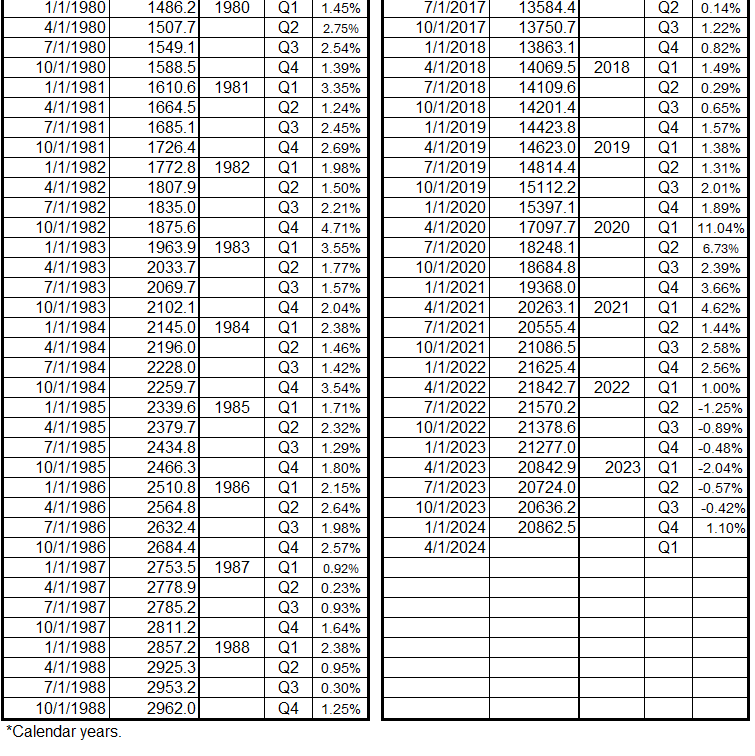
Appendix 1 shows how the M2 growth rate is determined by calendar year quarters. Tables comparing M2 money supply growth with inflation are constructed below from that growth rate data.
As in previous studies,1–6 we use the Consumer Price Index (CPI) to calculate the inflation rate. The data here for inflation growth is organized by calendar year quarters, as shown in Appendix 2, and is the same used for most of the previous studies.2–6
Table 5. M2 Growth and Inflation (CPI), Coincident Data, 1959-2023*
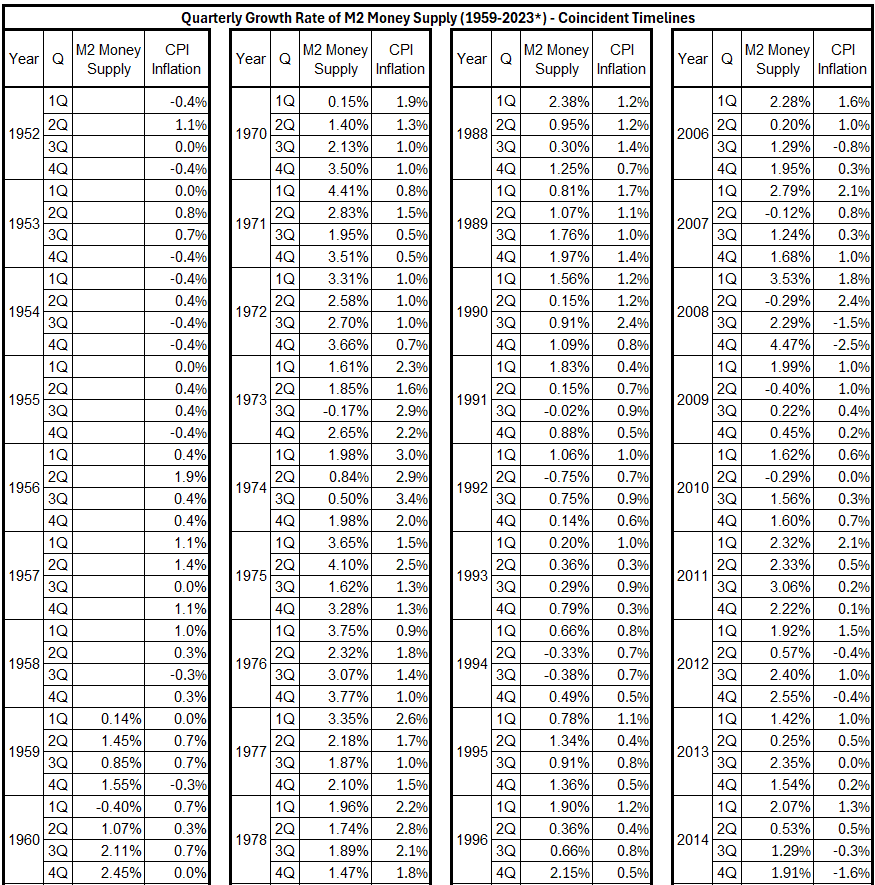
Table 6. M2 Growth and Inflation (CPI), M2 Leads by 3 Months, 1959-2023*


Table 7. M2 Growth and Inflation (CPI), M2 Leads by 6 Months, 1959-2023*
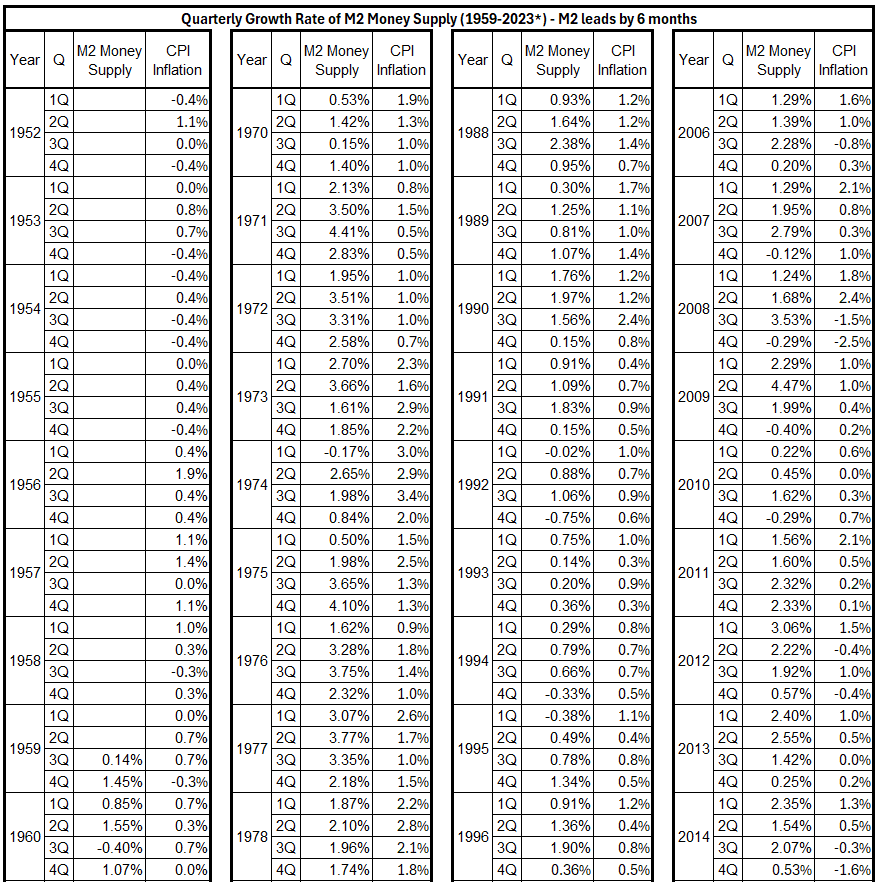

Table 8. M2 Growth and Inflation (CPI), M2 Leads by 9 Months, 1959-2023*
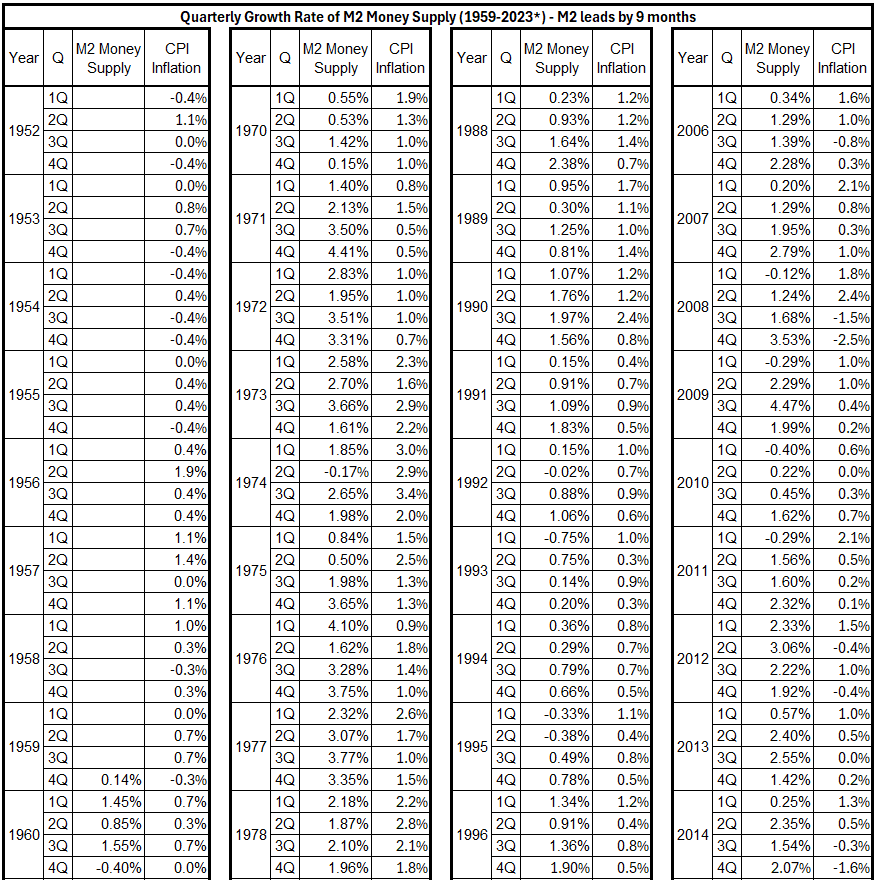

Table 9. M2 Growth and Inflation (CPI), M2 Leads by 12 Months, 1959-2023*
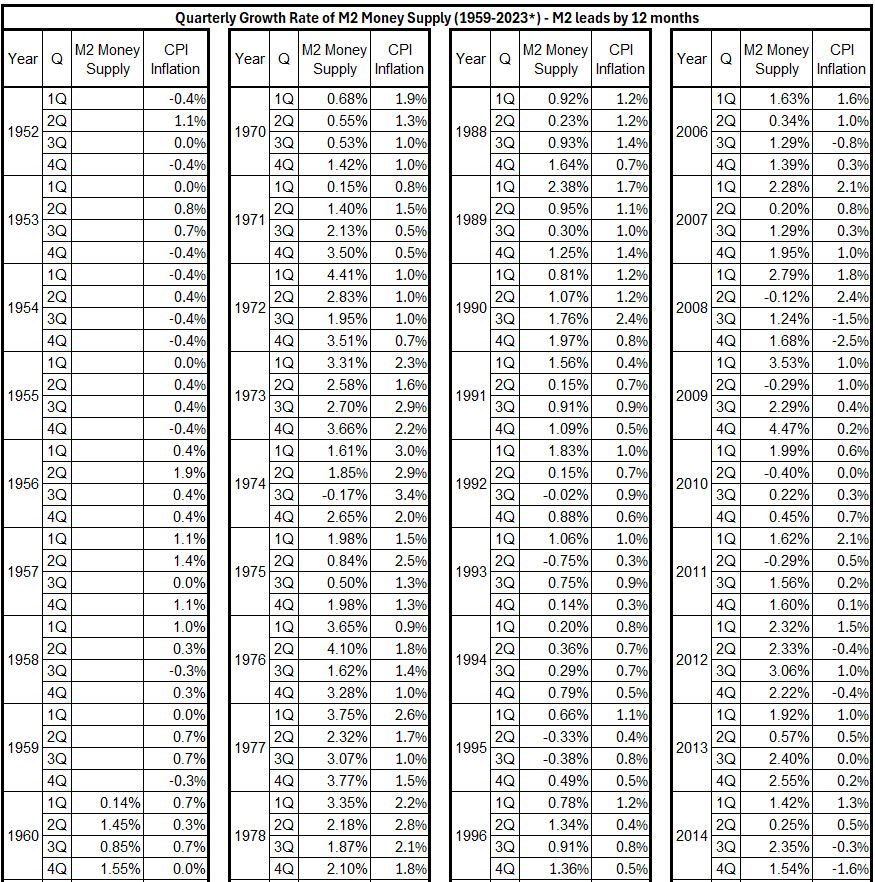
Table 10. M2 Growth and Inflation (CPI), M2 Leads by 18 Months, 1959-2023*
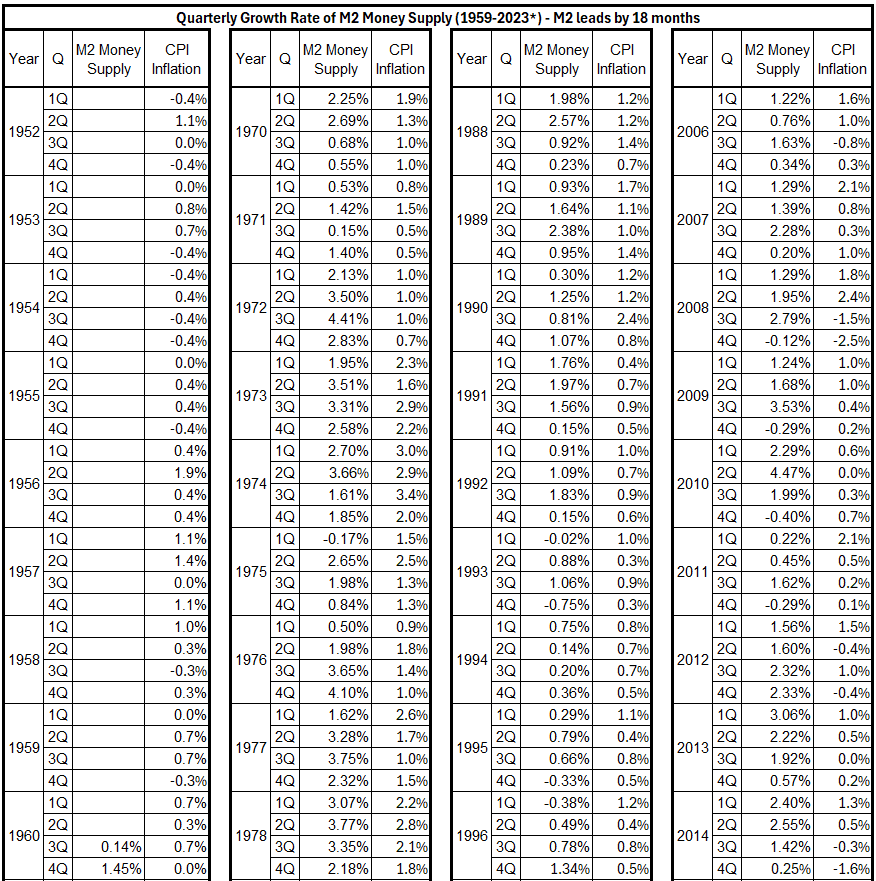
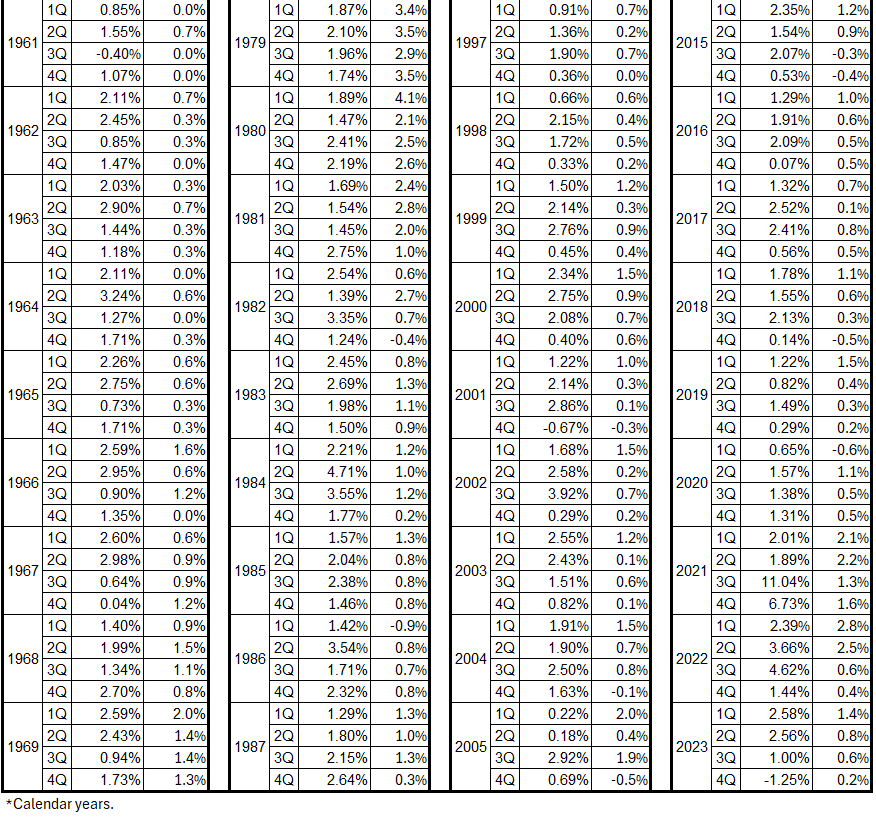
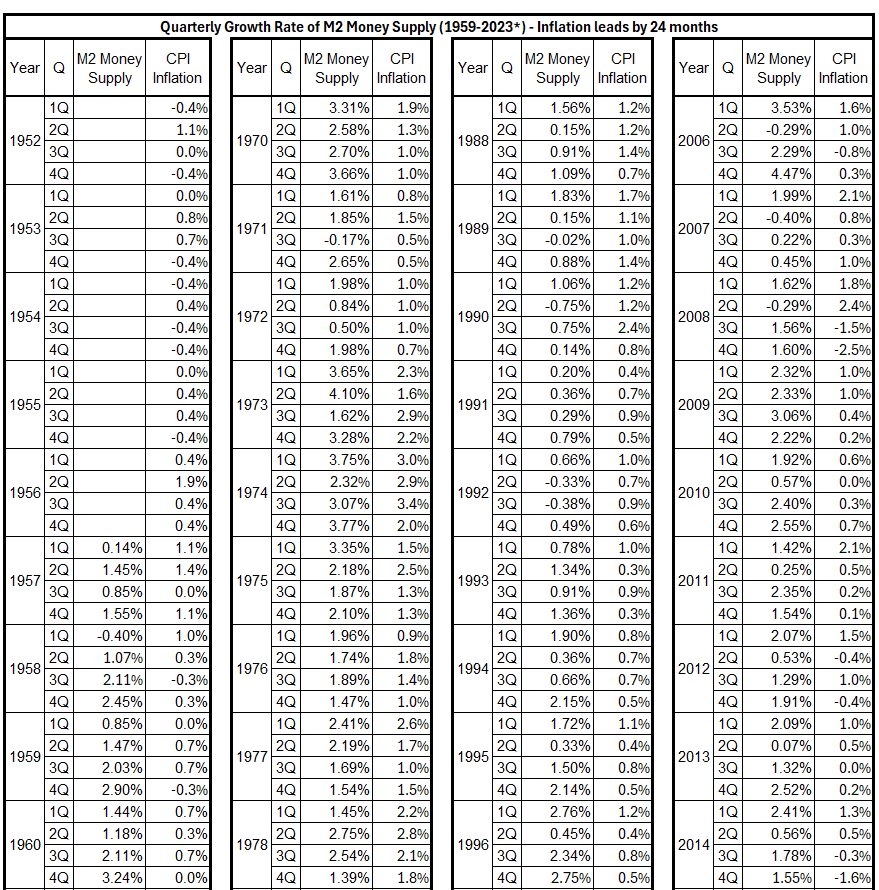
Table 11. M2 Growth and Inflation (CPI), M2 Leads by 24 Months, 1959-2023*
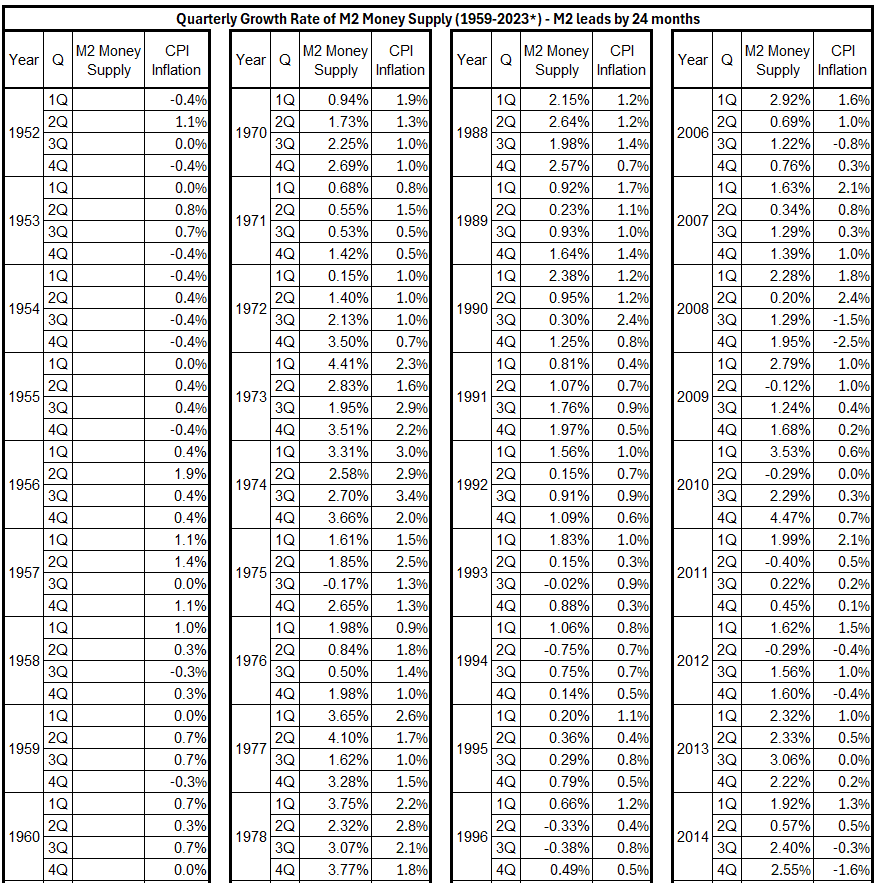
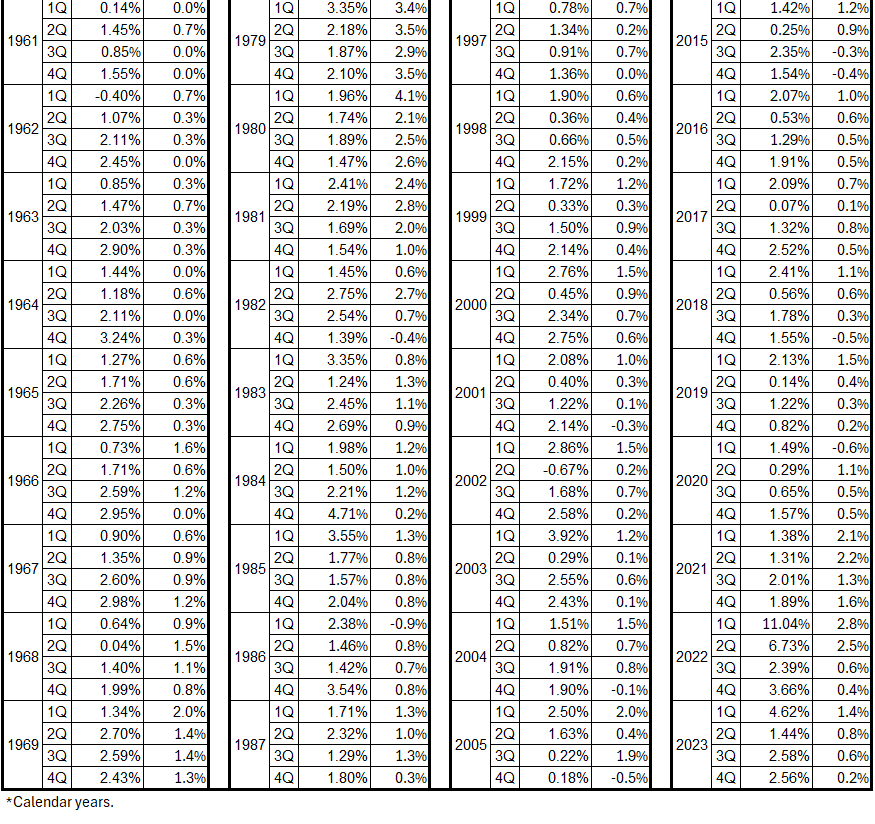
Table 12. M2 Growth and Inflation (CPI), M2 Lags by 3 Months, 1959-2023*
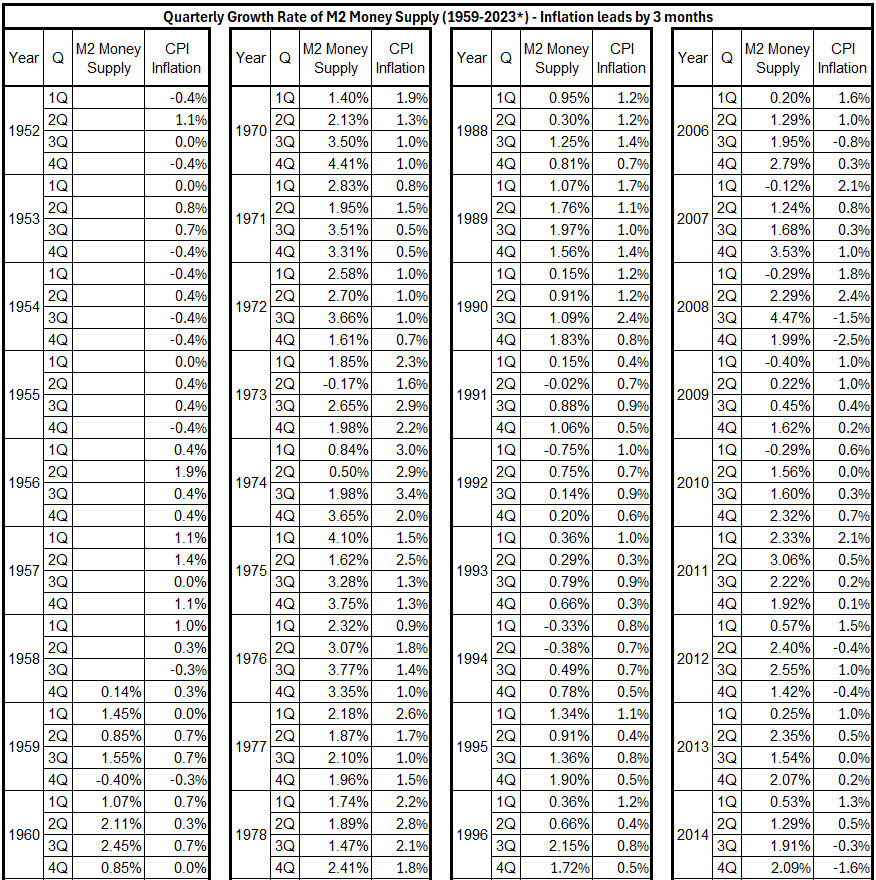
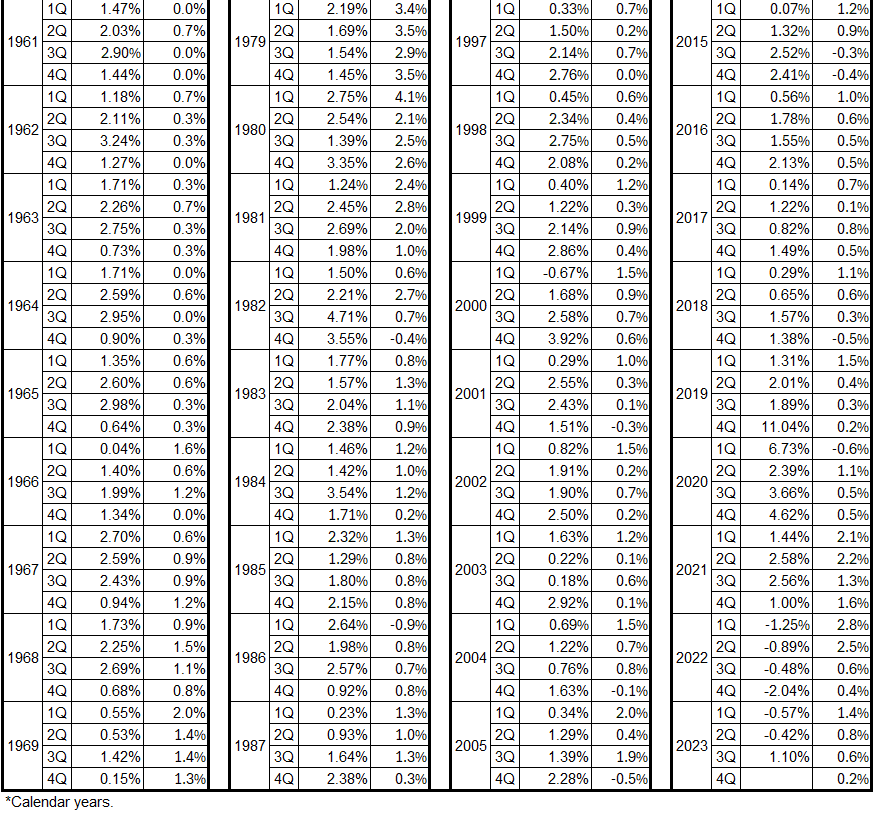
Table 13. M2 Growth and Inflation (CPI), M2 Lags by 6 Months, 1959-2023*
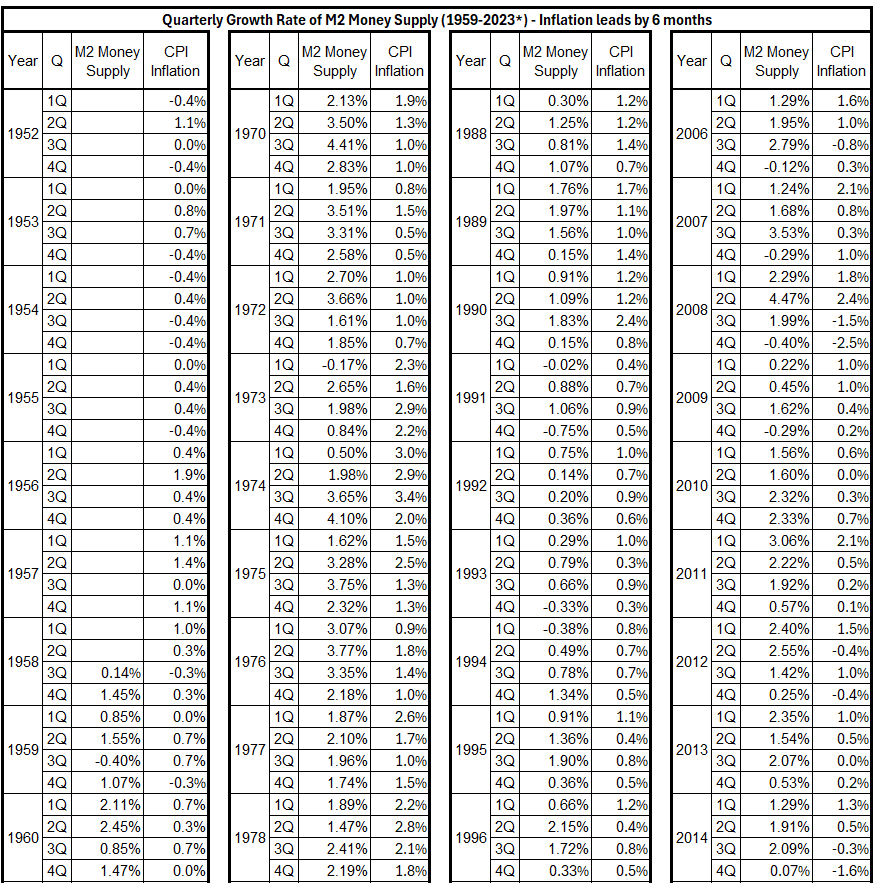
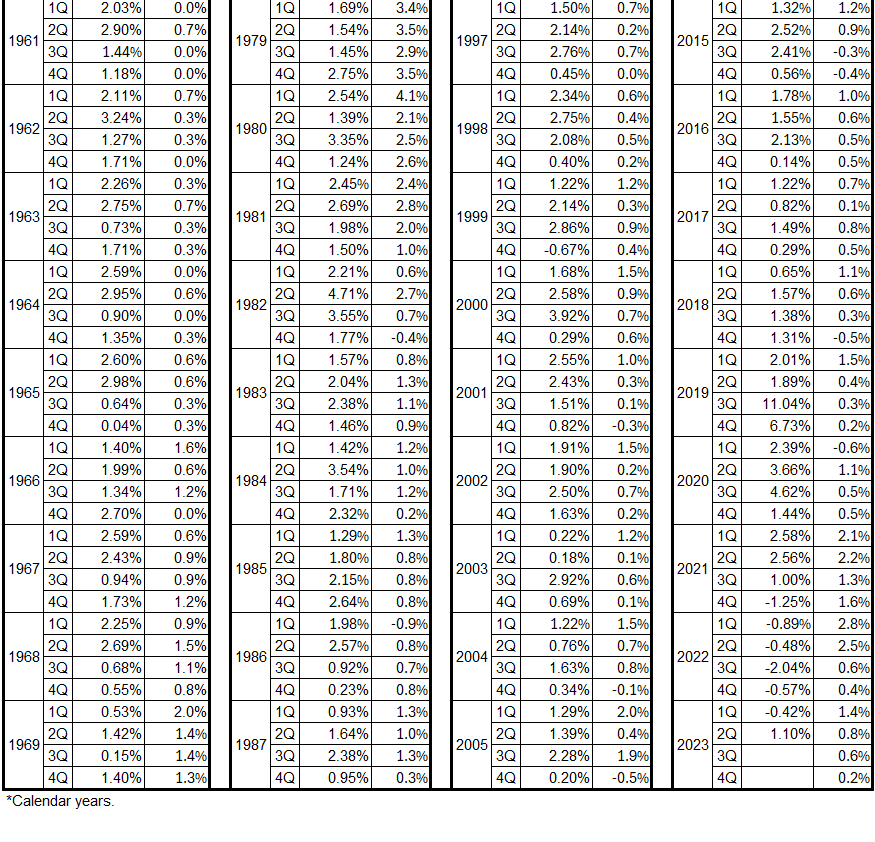
Table 14. M2 Growth and Inflation (CPI), M2 Lags by 9 Months, 1959-2023*

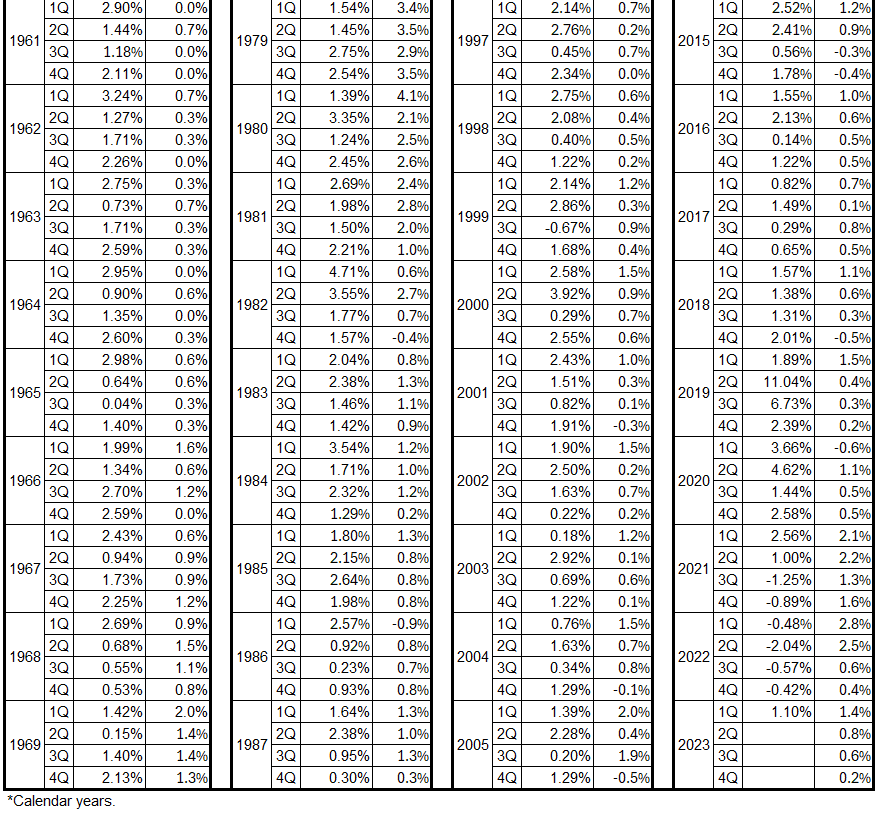
Table 15. M2 Growth and Inflation (CPI), M2 Lags by 12 Months, 1959-2023*
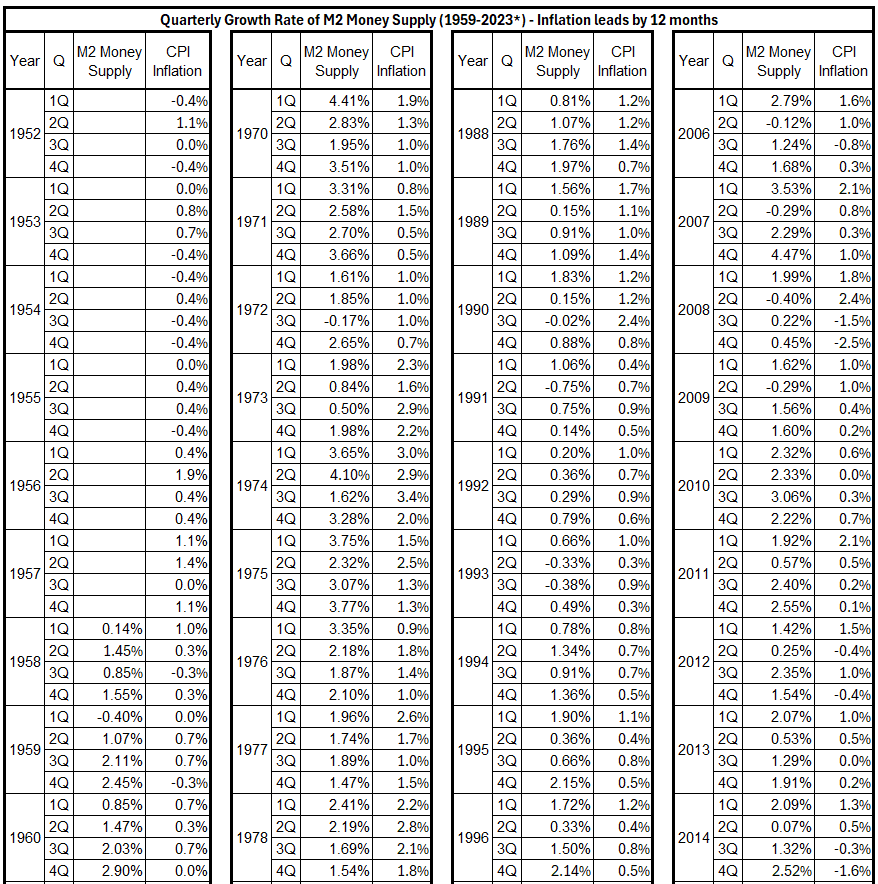

Table 16. M2 Growth and Inflation (CPI), M2 Lags by 18 Months, 1959-2023*
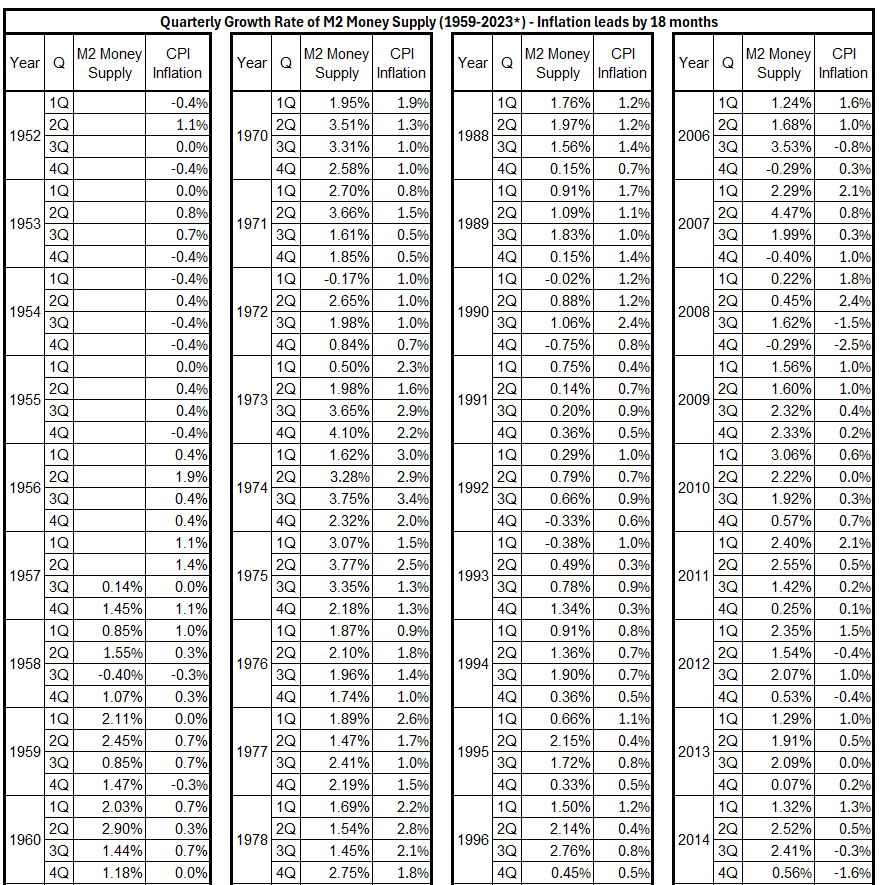
Table 17. M2 Growth and Inflation (CPI), M2 Lags by 24 Months, 1959-2023*
Analysis
Figure 4 shows the annualized changes for the M2 money supply and CPI inflation for every quarter from 1960 to 2022.9
Figure 4. Changes in M2 and CPI Quarterly (4-Qtr Changes), 1960-2022
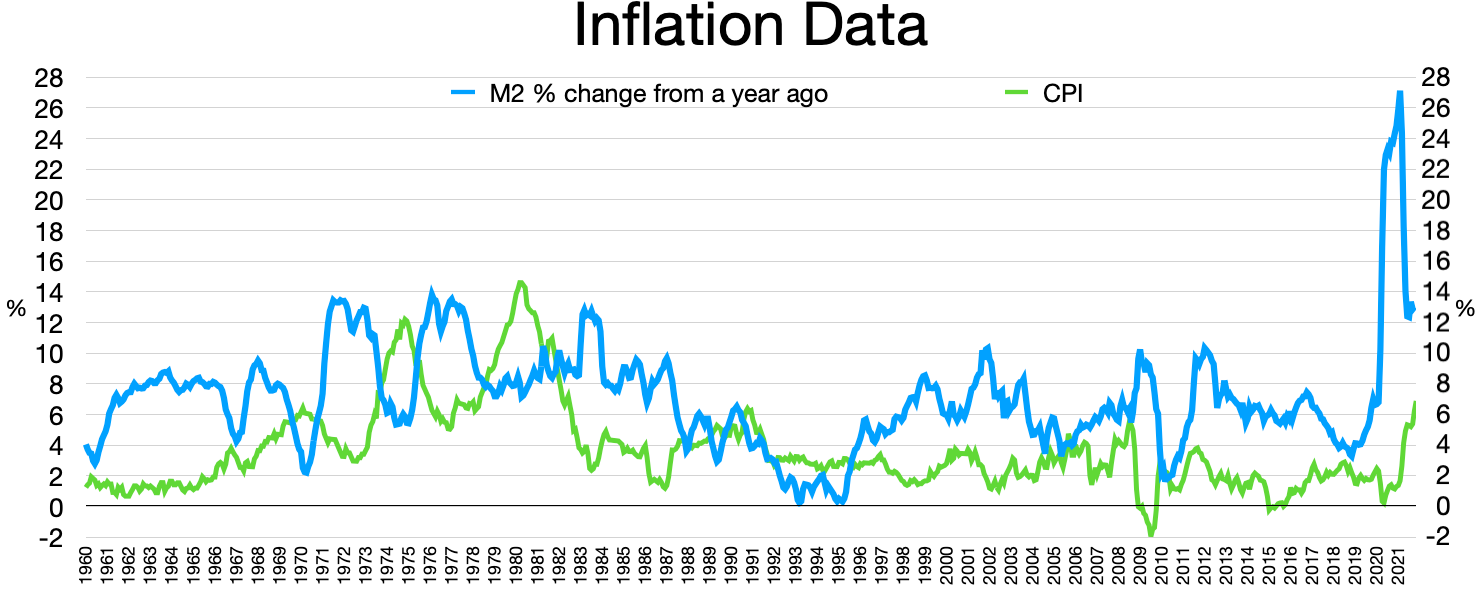
By Wikideas1 – Own work https://fred.stlouisfed.org/graph/?g=KeaiLiberationreport.com, CC0, https://commons.wikimedia.org/w/index.php?curid=113657213.
Several times, a peak in M2 change is aligned (or nearly aligned) with a minimum in inflation and vice versa, for example, 1960, 1967, 1970, and 2000-2002. In addition, there are also times when peaks or minima are aligned, for example, 1997 and 2005. There are fewer alignment cases for the latter situation, and the magnitude of the changes is small.
In many areas in the graph, alignments are offset significantly (say more than ~ one quarter). Thus, the correlation assessment from Figure 4 seems problematic.
Figure 5 shows the quarterly M2 money supply and CPI changes from 1959 through 2023.
Figure 5. Quarterly Changes for M2 and CPI 1959-2023
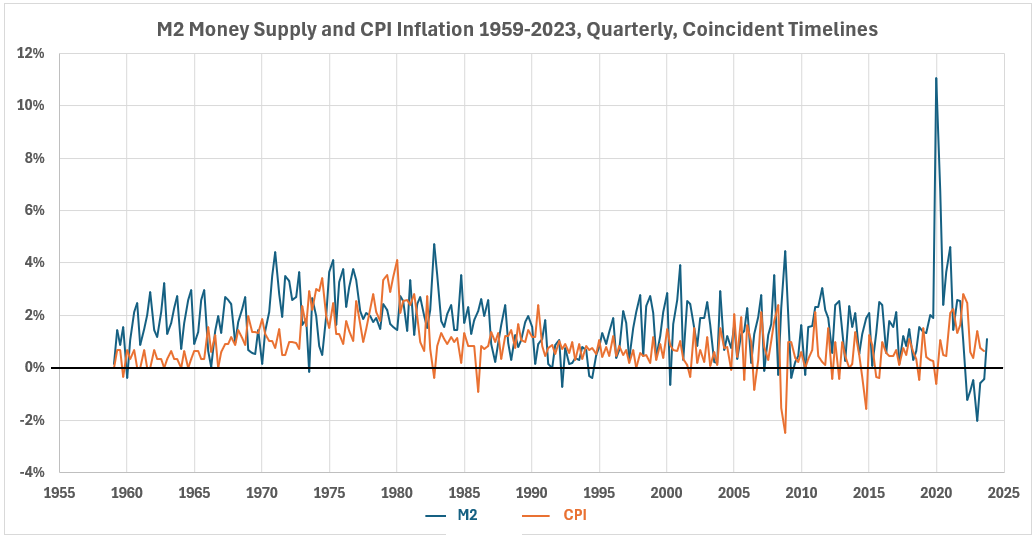
The changes in Figure 5 are slightly more volatile for M2 than for inflation. However, there is an exception in 2020 when there is a huge spike in M2. Visual inspection shows no obvious correlation patterns between the two variables, except for occasional large opposite changes.
Figure 6 shows the scatter plot diagram for M2-CPI data pairs for the 259 quarters in this study from 1959 to 2023.
Figure 6. Quarterly Changes in M2 Money Supply (x) vs. CPI Inflation (y) 1959-2023
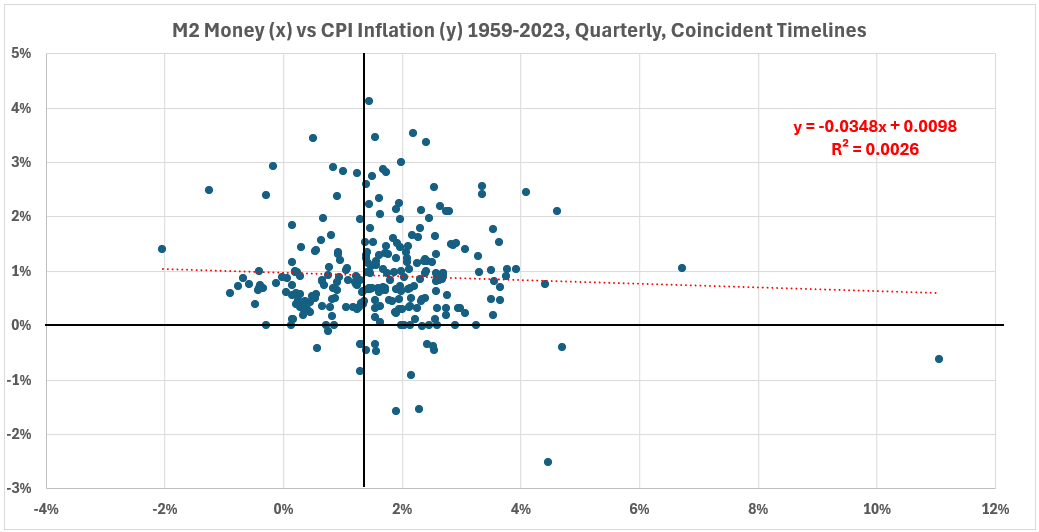
A negligible negative association exists between M2 and CPI over the 259 quarters studied, R = –5.1% and R2 = 0.3%. These data pairs are for coincident timelines. A more complete analysis involves comparisons of associations (correlations) when the timelines are offset quarterly for up to two years.
The entire data set does not offer useful correlation analysis potential. Future work will study what happens when shorter time periods within the 64-year time frame are analyzed.
Conclusion
The fine data granularity (230 data point pairs) may provide useful information when analyzing various time periods. We will look at the time periods for each of the three inflation behaviors shown in Table 4. As done before,1–6 timeline shifts will be examined to see if any information can be determined about possible cause-and-effect relationships. The next step in this process will be to analyze the positive inflation surges from 1959-2023.
Appendix 1
The M2 money supply data from 1959 through 4Q 2023 is from the Fed database.9
The table below shows the conversion of the Fed data to growth rate by quarter.
Table A1. Growth Rate of M2 1959-2023* (Quarter-over-Quarter)
Appendix 2
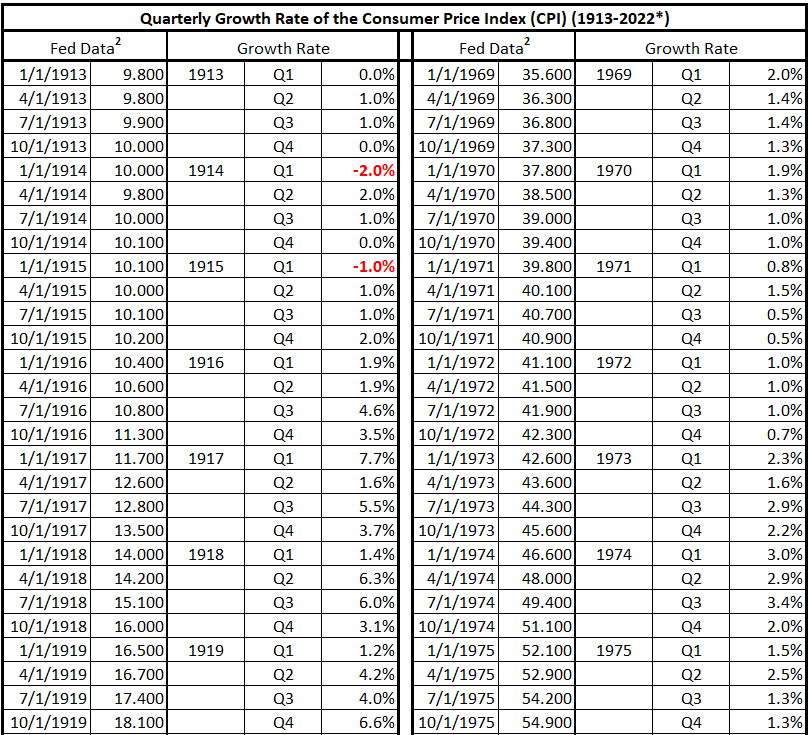
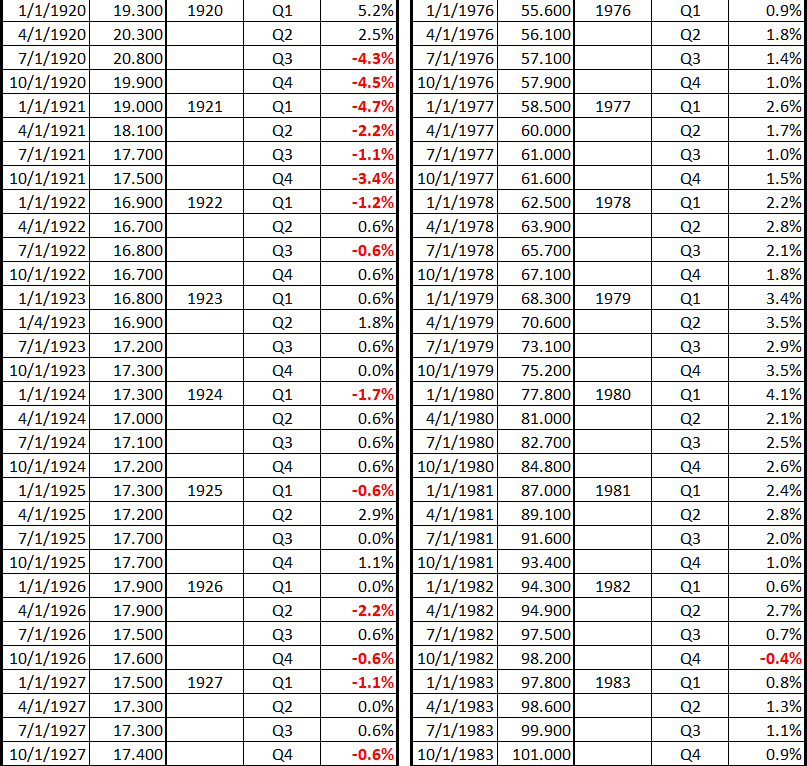
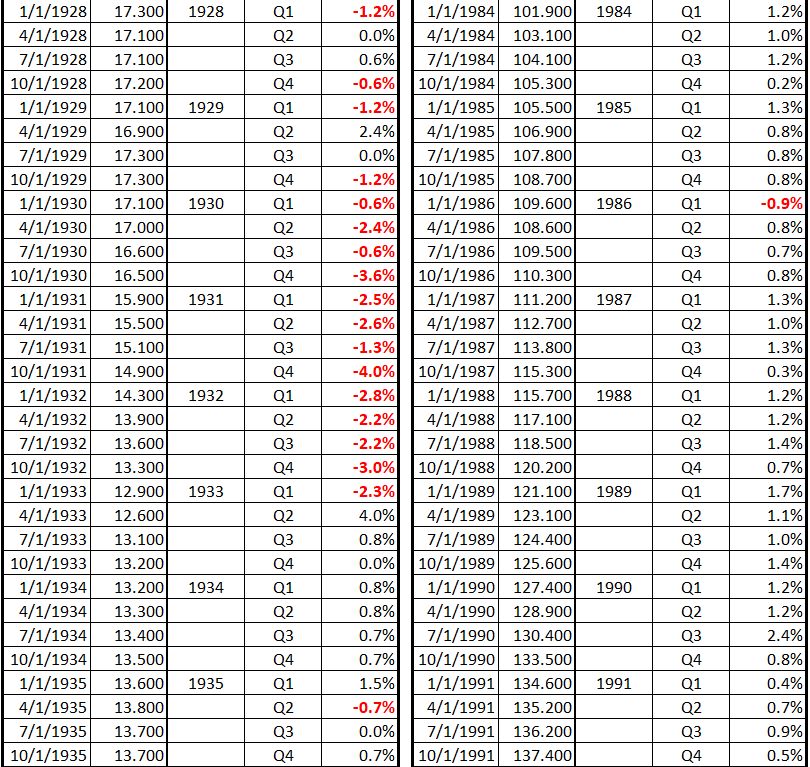
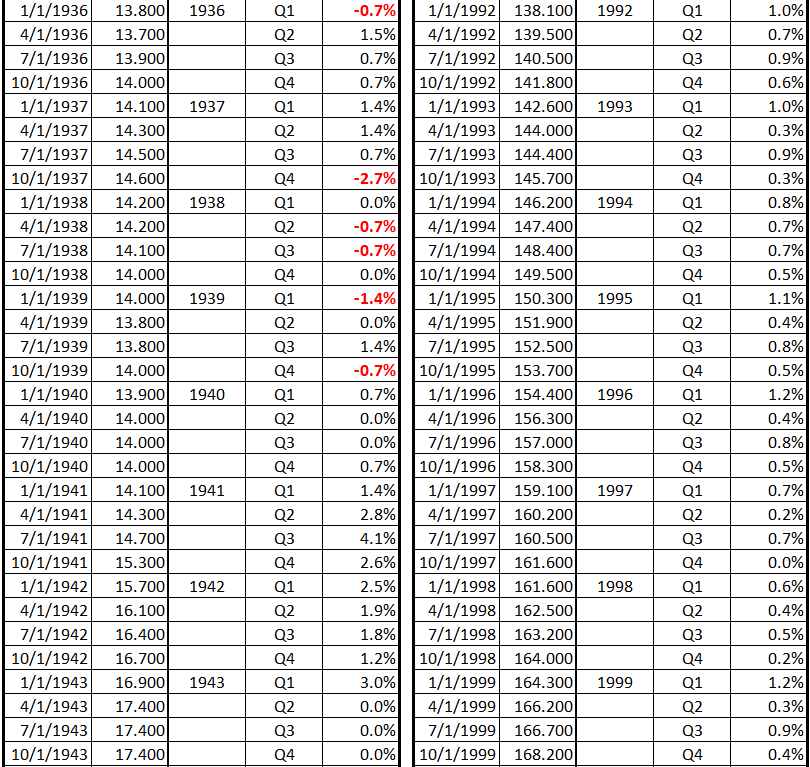
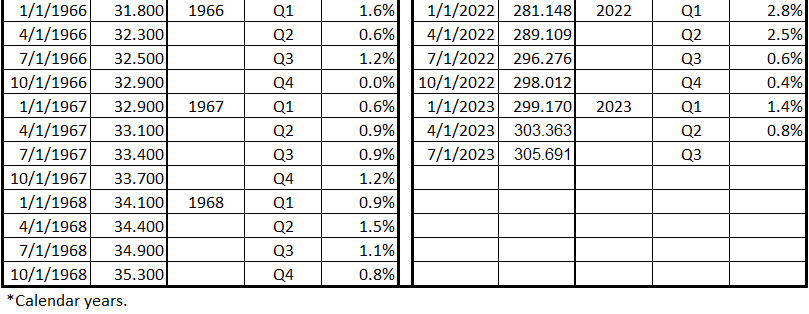
The Consumer Price Index (CPI) data is from the Fed database.7 The table below shows the conversion of the Fed data to growth rate by quarter.
Table A2. Growth Rate of CPI 1913-2022* (Quarter-over-Quarter)


Footnotes
1. Lounsbury, John, “Government Spending and Inflation. Reprise and Summary,” EconCurrents, August 20, 2023. https://econcurrents.com/2023/08/20/government-spending-and-inflation-reprise-and-summary/.
2. Lounsbury, John, “Consumer Spending and Inflation. Part 4,” EconCurrents, September 23, 2023. https://econcurrents.com/2023/09/23/consumer-credit-and-inflation-part-4/.
3. Lounsbury, John, “Mortgage Debt and Inflation. Part 4,” EconCurrents, October 22, 2023. https://econcurrents.com/2023/10/22/mortgage-debt-and-inflation-part-4/.
4. Lounsbury, John, “Nonfinancial Corporate Credit. Part 4,” EconCurrents, March 3, 2024. https://econcurrents.com/2024/03/03/nonfinancial-corporate-credit-and-inflation-part-4/.
5. Lounsbury, John, “Financial Sector Debt and Inflation. Part 4,” EconCurrents, March 31, 2024. https://econcurrents.com/2024/03/31/financial-sector-debt-and-inflation-part-4/.
6. Lounsbury, John, “Federal Deficit Spending (Quarterly) and Inflation. Part 4,” EconCurrents, April 28, 2024. https://econcurrents.com/2024/04/28/federal-deficit-spending-quarterly-and-inflation-part-4/.
7. Federal Reserve Economic Data, Consumer Price Index for All Urban Consumers: All Items in U.S. City Average, Index 1982-1984=100, Monthly, Not Seasonally Adjusted. https://fred.stlouisfed.org/graph/?id=CPIAUCNS.
8. Federal Reserve Economic Data, M2NS, M2, Billions of Dollars, Monthly, Not Seasonally Adjusted. https://fred.stlouisfed.org/series/M2NS.
9. Wikipedia, “Money Supply,” last updated March 5, 2024. https://en.wikipedia.org/wiki/Money_supply
Read Part 2 >>> M2 Money Supply and CPI Inflation - Part 2
More By This Author:
Book Review: Concordian Economics, Volume 1
January 2020 Headline New Home Sales Improved?
Crash Of '29 And The Catastrophe That Followed


Comments
Log in or sign up to join the conversation.