
Look At The Big Picture...Buy Equities
The Big Picture
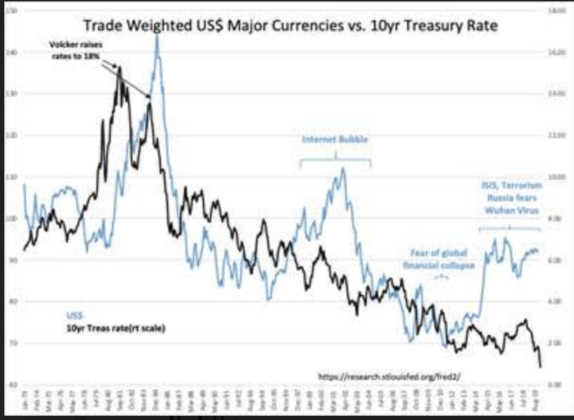
The DXY Index and US 10-year Treasury rate have been falling together since mid-Feb 2020. This may signal the beginnings of a reversal of global capital flows into the US. The trigger, which one could not predict ahead of time, appears to be 10-year Treasury rate falling to ~1.5%.
A review of the USD (US Dollar) history monthly from 1973 shows periods of USD strength as global investors sought out US assets during periods of higher returns or as a safe haven. In the early 1980's and late 1990’s it was the lure of highest global returns. A recent period of USD strength began with Russia’s 2014 invasion of Ukraine, and continued as US initiated economic sanctions against ‘terror states’ and moved to renegotiate global tariff barriers to trade.
Today may be the early stage of reversal in USD strength. Understanding this requires some hindsight.
Global capital flows are based on a complex mix of factors which have evolved over decades with the development of Developing/Emerging (23 countries- Brazil, Chile, China, Colombia, Czech Republic, Egypt, Greece, Hungary, India, Indonesia, Korea, Malaysia, Mexico, Morocco, Qatar, Peru, Philippines, Poland, Russia, South Africa, South Korea, Taiwan, Thailand, Turkey, and United Arab Emirates) through capital flows from developed markets (Europe, Australia, Japan Canada, US).
As globalization progressed and global wealth increased, a number of country leaderships shifted towards autocratic governance, threatening citizen property rights. In response, business owners and investors with newly liquid capital due to the influx of developed capital sought safe havens, and returned as much capital back to developed markets as they could.
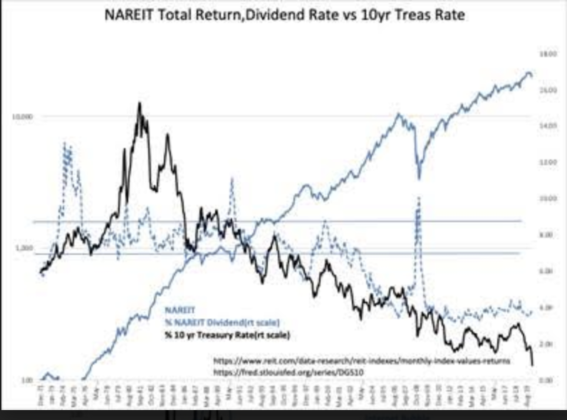
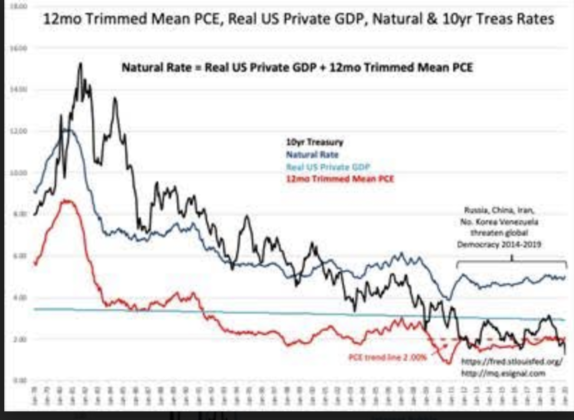
The evidence comes from REIT(Real Estate Investment Trust) dividend yields, sovereign debt history and the Natural Rate Indicator. These reveal that capital flowing into REITs and sovereign debt began to push dividend rates and yields lower late 1990's-2000 range. These asset classes gradually became over-bought. US REITS today offer ~3.5% yield, or half the 7%. This asset class, and the 10-year Treasury today at 0.77%, typically had been higher than the Natural Rate benchmark since 1978.
Compared to the current Natural Rate’s ~5%, the 10-year Treasury is grossly over-priced. These flows continued as emerging markets became more liquid with the developed market capital influx. The boomerang of capital back to developed market sovereign debt and real estate continued.
Flows accelerated with heightened global threats when Russia invaded Ukraine in 2014. Roughly in the same time frame, China’s Xi and Turkey’s Erdogan were instituted autocratic control of their respective counties. Capital flight from these countries caused exchange rate deterioration of the Chinese Yuan and Turkish Lira. US sanctions against North Korea, Iran, Venezuela, China and threats of the same against Europe, Canada and Mexico to force renegotiation of tariff imbalances, were reflected in additional USD strength that, in some instances, correlated with declines in sovereign debt rates and specific exchange rates.
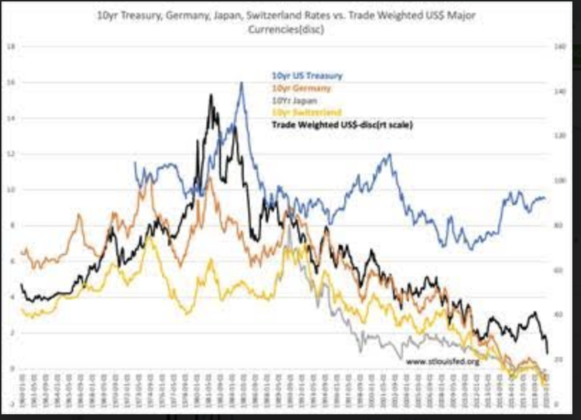
The net impact for Switzerland's, Germany's, and Japan's 10-year sovereign debt was the inability to absorb this capital flow with ~$300 billion, ~$2.3 trillion and ~$10.5 trillion outstanding respectively. Negative rates were experienced with Switzerland’s rate; the least able to absorb the influx of capital, and most negative at -0.70%.
Most investors have assumed that lower rates indicate actions by central bankers in response to economic weakness. This was, in fact, foreign capital seeking safer and better returns as their domestic situations deteriorated. Paying a negative rate to exit a 10% decline in one’s own currency is a good relative return. The economies of developed nations, while slow, have in fact been mostly growing, even though narrow rate spreads curbed bank lending and higher economic expansion. Low rates and narrowing/inverted yield curves, which have long been believed to signal economic distress, have misunderstood the impact that global capital shifts have had.
Yield curve relationships are part of nearly every investment trading algorithm in use today. Algorithms operate using past trends. They operate using mathematical models and only incorporate a new trend when the bulk of investors have already shifted capital allocations enough to have a persistent price impact. This leaves algorithms, at all times, leading from behind and exaggerating a trend, even when the underlying basis has changed direction. There is no evidence that any algorithm today has adjusted for the cultural biases occurring as global capital seeks out the better opportunities.
Markets are complex at any time, but with the cultural differences between developed vs. emerging markets, it becomes ‘complexity squared’. The best we can do is to be aware of this and observe carefully for signs that a significant change may be in process. The correlation of falling 10-year Treasury with the DXY Index is one of these that is new. It appears that US 10-year Treasury falling below 1.5% was that global trigger.
On Feb. 20th, 2020, once the 10-year Treasury rate fell to and below 1.5%, the DXY Index began to decline rapidly. The decline has been ~4% in the value of the currency package making up this USD index, and appears to be a historical decline. Let’s add emphasis, 4% decline in 3 weeks in the USD is a huge decline in such a short period. Something significant appears to be at work.
For US algorithm traders, falling rates signal economic decline, and they sell stocks and commodities and shift into Treasuries. It is why WTI (West Texas Intermediate Oil Prices) have plunged as short-term economic fears grow. For foreign investors, it is a combination of US rates no longer meeting return/safe haven perceptions, and losses on the currency exchange now going against them.
A 4% decline in the USD exchange rate represents 4 years of yields at 1% and becomes a powerful motivator to exit. Rates on the 10-year Treasury have fallen as low as 0.67% today as algorithms drive the trend lower. Algorithmic buying of the 10-year Treasury is being countered by foreign investors selling and exiting USD assets. What we are seeing are actions by investors with differing perceptions. The media is attempting to provide a simple interpretation that is not possible,
The best approach, in my experience, is to follow economic trends. Rates, prices of the USD, oil, stocks, etc. are determined by short-term market psychology, not economics. Economics become a factor in market psychology only after a trend of economic reports causes market psychology to conform. When market psychology diverges from economics, as it does frequently during a cycle, it is when market psychology snaps back to the economic data that the best returns occur. What one hears in the media is a Tower of Babel.
In my opinion, we are seeing a wide misreading of the current economic conditions. It appears that foreign investors no longer happy with USD returns are in the process of repatriating capital, which drives the USD lower. A falling USD is very positive for US high-value exports, which stimulates US productivity, employment, retail sales, and wage growth. With existing US economic conditions already positive, a weaker USD can only add to US economic expansion.
The Big Picture says to buy equities.
The information in this blog post represents my own opinions and does not contain a recommendation for any particular security or investment. I or my affiliates may hold positions or other interests ...
more

