Let’s Discuss The Claim Home Prices Fell 17.6 Percent In The Last Year

Median home prices from the Commerce Department via St. Louis Fed. Annotations by Mish.
The chart shows the median price of a new home has fallen 17.6 percent from a year ago. Given the massive margins of error in these Census Bureau reports, the number is highly suspect.
Nonetheless, let’s assume that the stat is true.
Q: What does median price have to do with home prices or “sticky inflation” in general?
A: The surprising answer to those who don’t understand the reports, is little or nothing.
This came up in a Tweet discussion yesterday.
No Sticky Inflation Based on Median Price?
Contrarian to @MishGEA, @EconguyRosie sees no 'sticky inflation' in housing data, because "median new home prices in October sunk a record -18% YoY, taking out the worst point (-15%) we saw in the Great Recession." 3 https://t.co/CU837YMPMA
— Zeno Heilmann (@ZenoHeilmann) November 29, 2023
Contrarian to @MishGEA, @EconguyRosie sees no ‘sticky inflation’ in housing data, because “median new home prices in October sunk a record -18% YoY, taking out the worst point (-15%) we saw in the Great Recession.”
My Take Supported by Bob Elliott
“Median New Home Price is one joke of a stat. How many rooms? What amenities? How big is the lot? Case-Shiller lags big but prices still rising.“
Bob Elliott Chimes In
Agree with this take. Like for like rising about 0.75% a month for the year. Weird to focus on stats that have huge composition shift issues when an accurate methodology is easily available with a 1 month lag. pic.twitter.com/TacFq7fwTg
— Bob Elliott (@BobEUnlimited) November 29, 2023
Weird Focus
“Agree with this take. Like for like rising about 0.75% a month for the year. Weird to focus on stats that have huge composition shift issues when an accurate methodology is easily available with a 1 month lag.“
Year-Over-Year Numbers

Five Year-Over-Year Measurements Through September
- CPI: +3.71%
- Case-Shiller National: +3.92%
- Case-Shiller 10-City: +4.76%
- OER: +7.08%
- Rent: +7.44%
CPI Rent
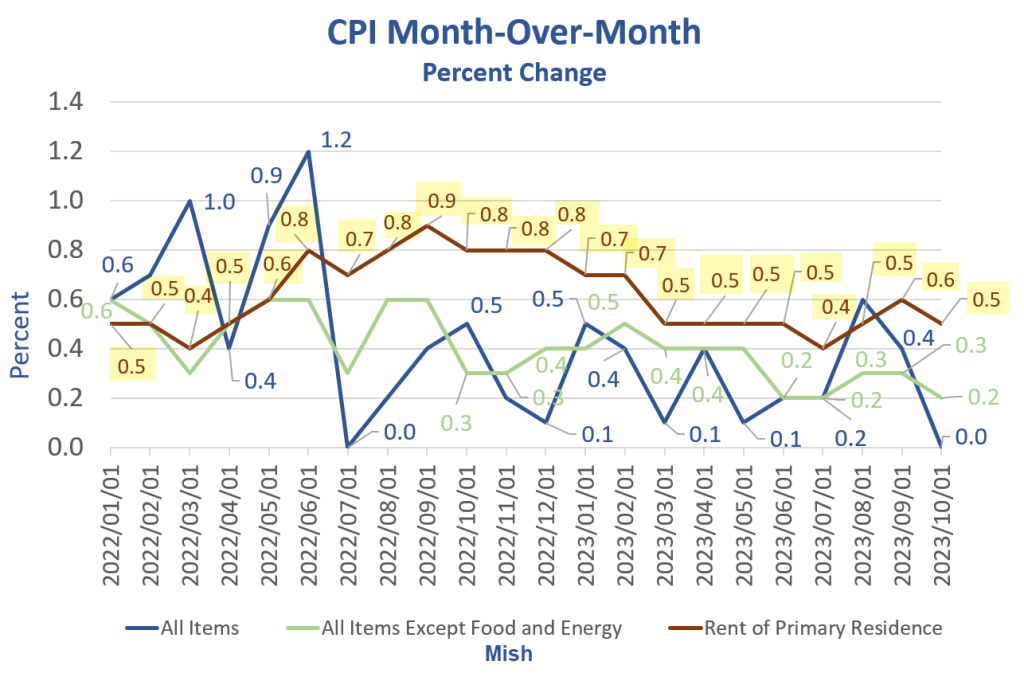
Rent of primary residence, the cost that best equates to the rent people pay, jumped 0.5 another percent in October.

CPI month-over-month data from the BLS, chart by Mish
For discussion of rent, please see Falling Rent is Extremely Rare, Yet Economists Keep Expecting That
Rent of primary residence has gone up at least 0.4 percent for 27 consecutive months!
People keep telling me rents are falling, I keep saying they aren’t (and the data proves it).
The Average Increase in the Price of Food Every Month for 32 Months is 0.6 Percent

CPI data from the BLS, chart by Mish
Please note The Average Increase in the Price of Food Every Month for 32 Months is 0.6 Percent
Talk of a tame CPI report this month is entirely an energy mirage and easy year-over-year comparisons.
Home Prices Hit a New Record High

National and 10-city prices from Case-Shiller, BLS for other data, chart by Mish
For discussion of the numbers, please see Home Prices Hit a New Record High According to Case-Shiller, Thank the Fed
Not only have we set a new all-time record, the current trend is up.
Key Points
- For 9 consecutive months (every month this year), the national and 10-city prices increased.
- Rent of primary residence has gone up at least 0.4 percent for 27 consecutive months!
- The Average Increase in the Price of Food Every Month for 32 Months is 0.6 Percent
Rosenberg Should Know Better
On the basis of a meaningless stat that ignores huge composition shift issues, there is allegedly no “sticky inflation” despite massive evidence that suggests otherwise.
Rosenberg not only should know better, I am certain he does know better. So what’s going on?
Rosenberg’s Tweet supports the view Rosie believes in, inflation will decline. We all tend to look for things that support our view, me included.
But in this case, his view is very extreme and downright weird, if not totally ridiculous.
More By This Author:
Huge Discrepancy Between GDP +5.2 Percent And GDI +1.5 Percent AcceleratesHuge Collapse In New Home Sales On Top Of Steep Negative Revisions
Extreme Hype Required To Get Attention: Climate, Politics, And $10 Million Bitcoin
Disclaimer: The content on Mish's Global Economic Trend Analysis site is provided as general information only and should not be taken as investment advice. All site content, including ...
more


