
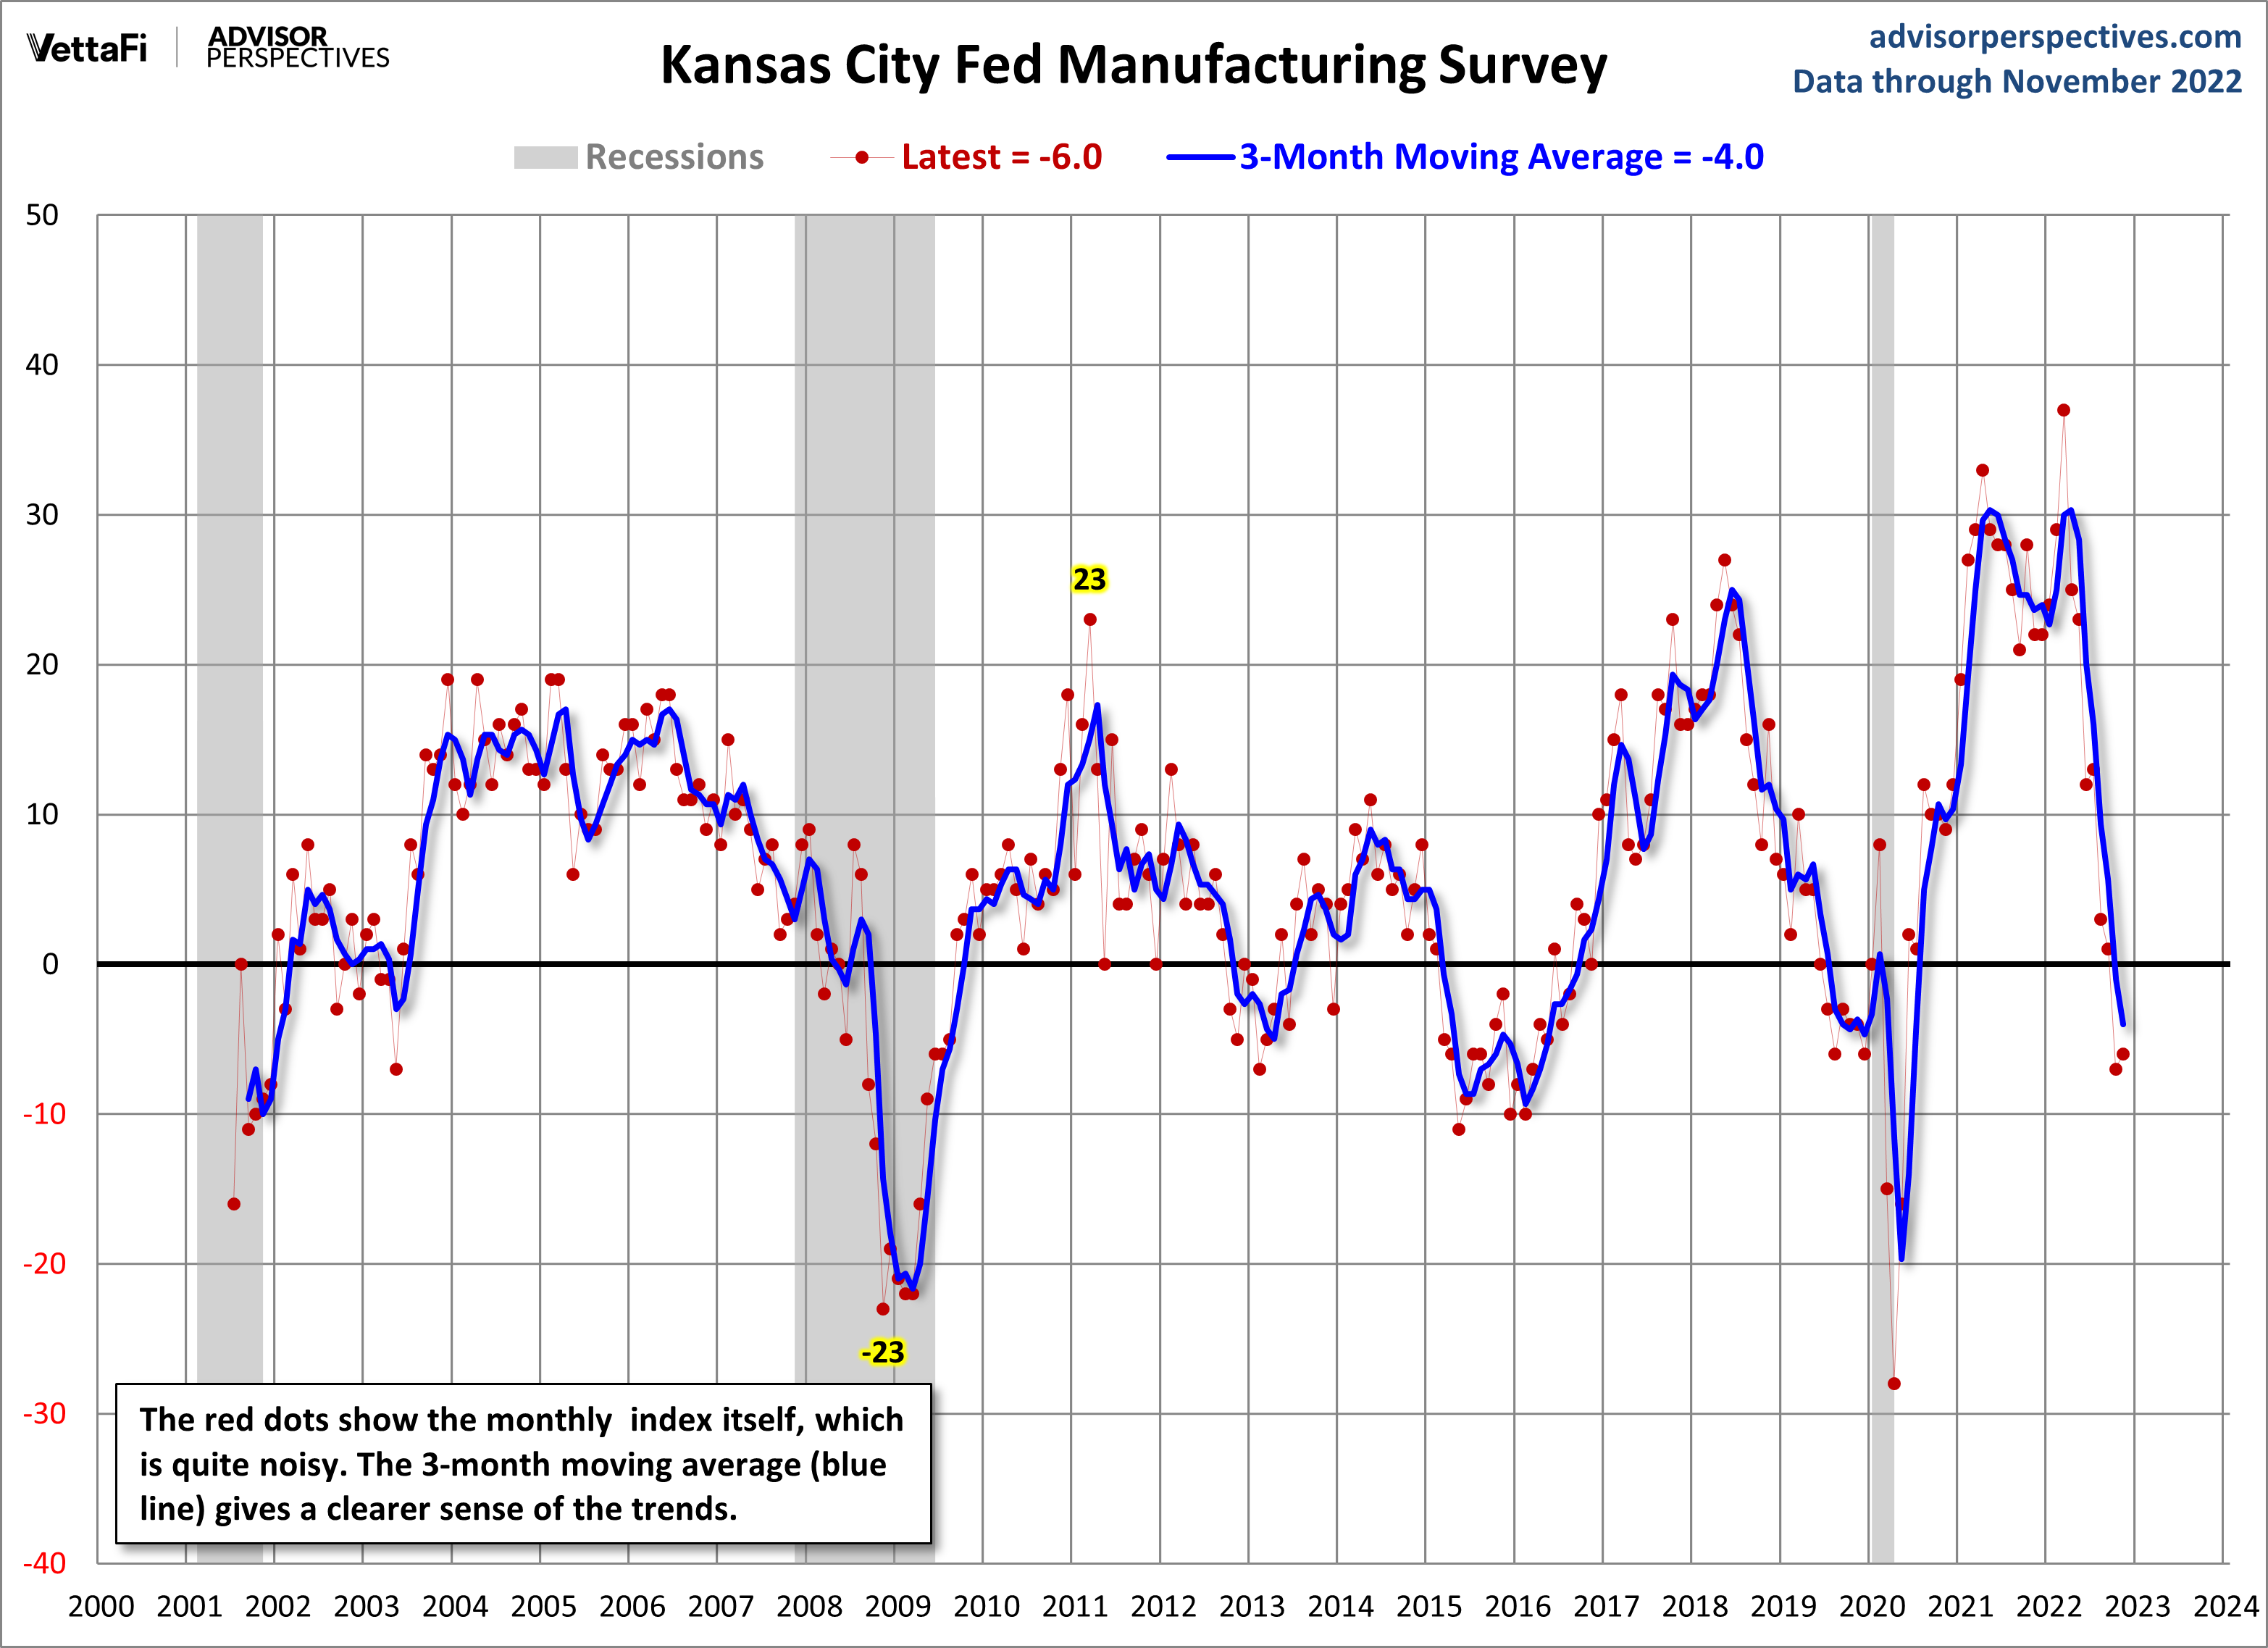
Kansas City Fed Mfg Survey: Activity Continues Decline
The latest index came in at -6, up 1 from last month, indicating contraction in November. The future outlook inched up to 0. All figures are seasonally adjusted. Here is a snapshot of the complete Kansas City Fed Manufacturing Survey.
Quarterly data for this indicator dates back to 1995, but monthly data is only available from 2001.
Here is an excerpt from the latest report:
Tenth District manufacturing activity declined at a similar pace compared to last month, while expectations for future activity were mostly flat or slightly positive (Chart 1, Tables 1 & 2). The monthly index of raw materials prices continued to slow in November and decreased compared to a year ago. Finished goods price indexes increased slightly from a month ago and compared to year-ago levels. Expectations for future raw materials and finished goods prices continued to fall.
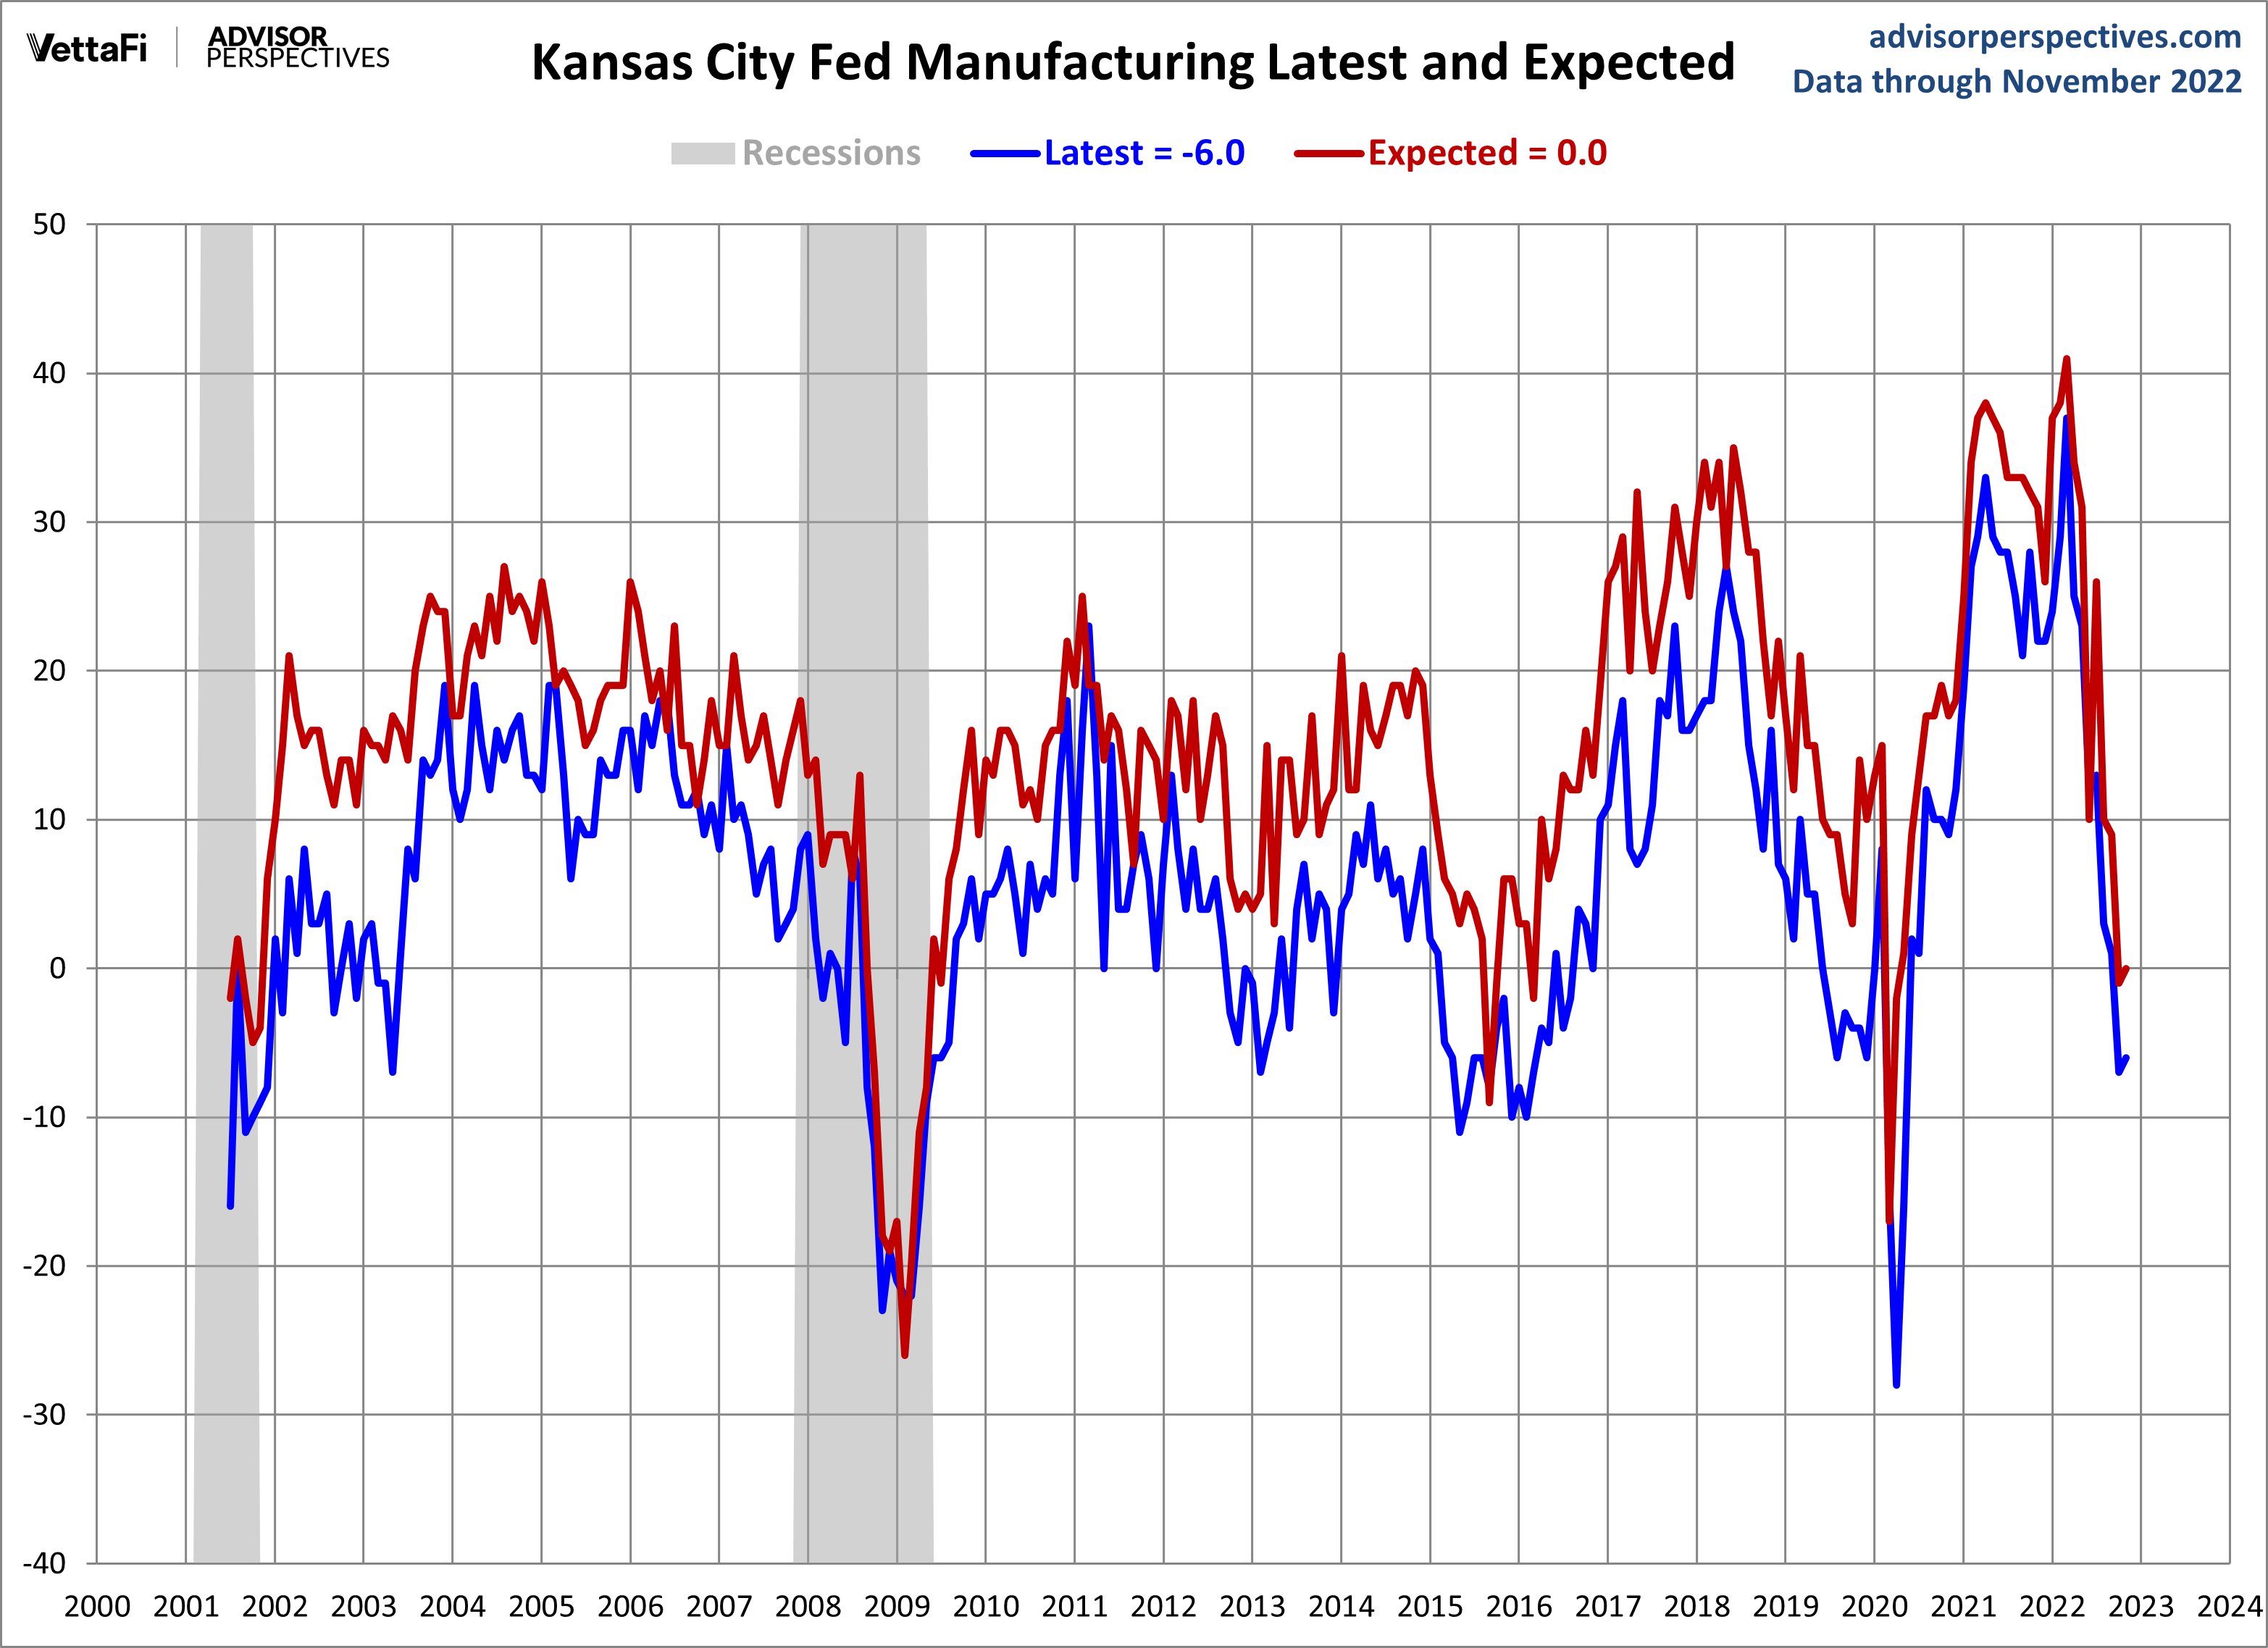
The month-over-month composite index was -6 in November, similar to -7 in October and down from 1 in September (Tables 1 & 2). The composite index is an average of the production, new orders, employment, supplier delivery time, and raw materials inventory indexes. The slower pace in factory growth in November was driven by decreased activity in primary metals, plastics and rubber products, chemical, furniture, and fabricated metals manufacturing. Month-over-month indexes were mostly negative in November. The current and expected supplier delivery time indexes reached their lowest level in survey history. Indexes for year-over-year factory activity slowed slightly in November, and the composite index decreased from 24 to 19. The future composite index increased from -1 to 0 in November, with the production, employee workweek, and finished goods inventories indexes also moving into positive territory.
Here is a snapshot of the complete Kansas City Fed Manufacturing Survey.
The next chart is an overlay of the general and future outlook indexes — the outlook six months ahead. Future factory indexes inched up to 0.
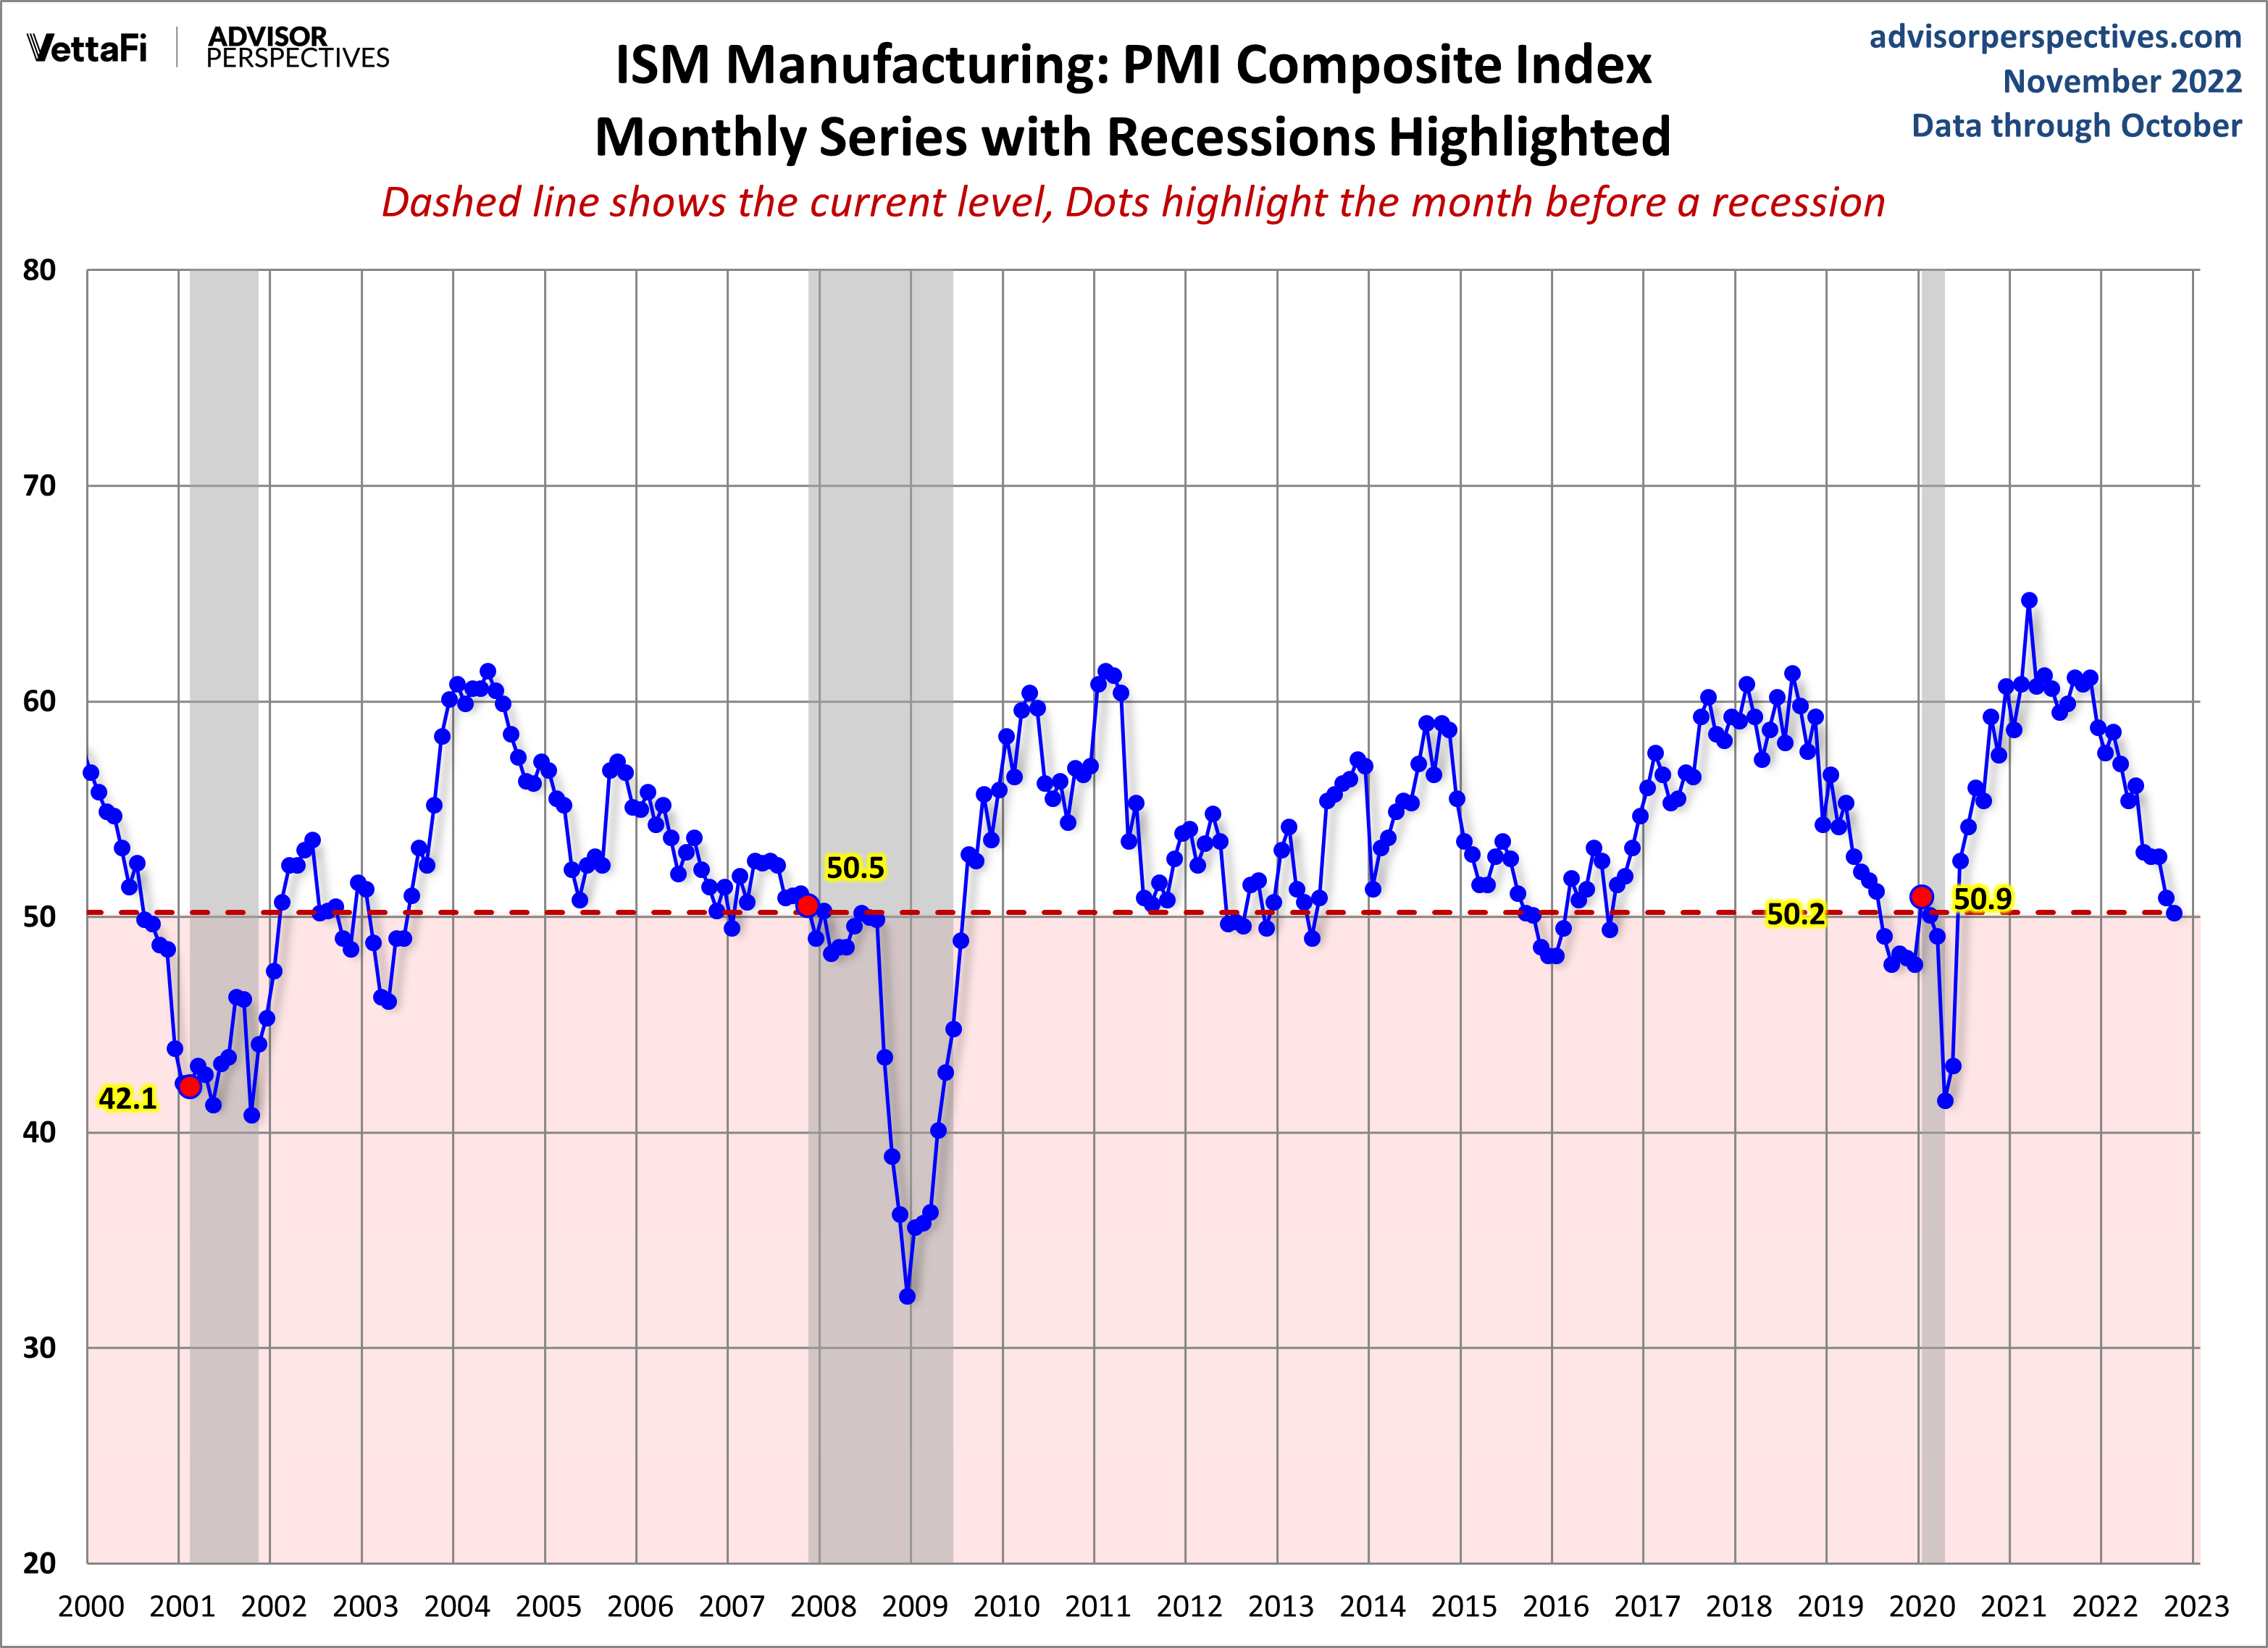
For comparison, here is the latest ISM Manufacturing survey.
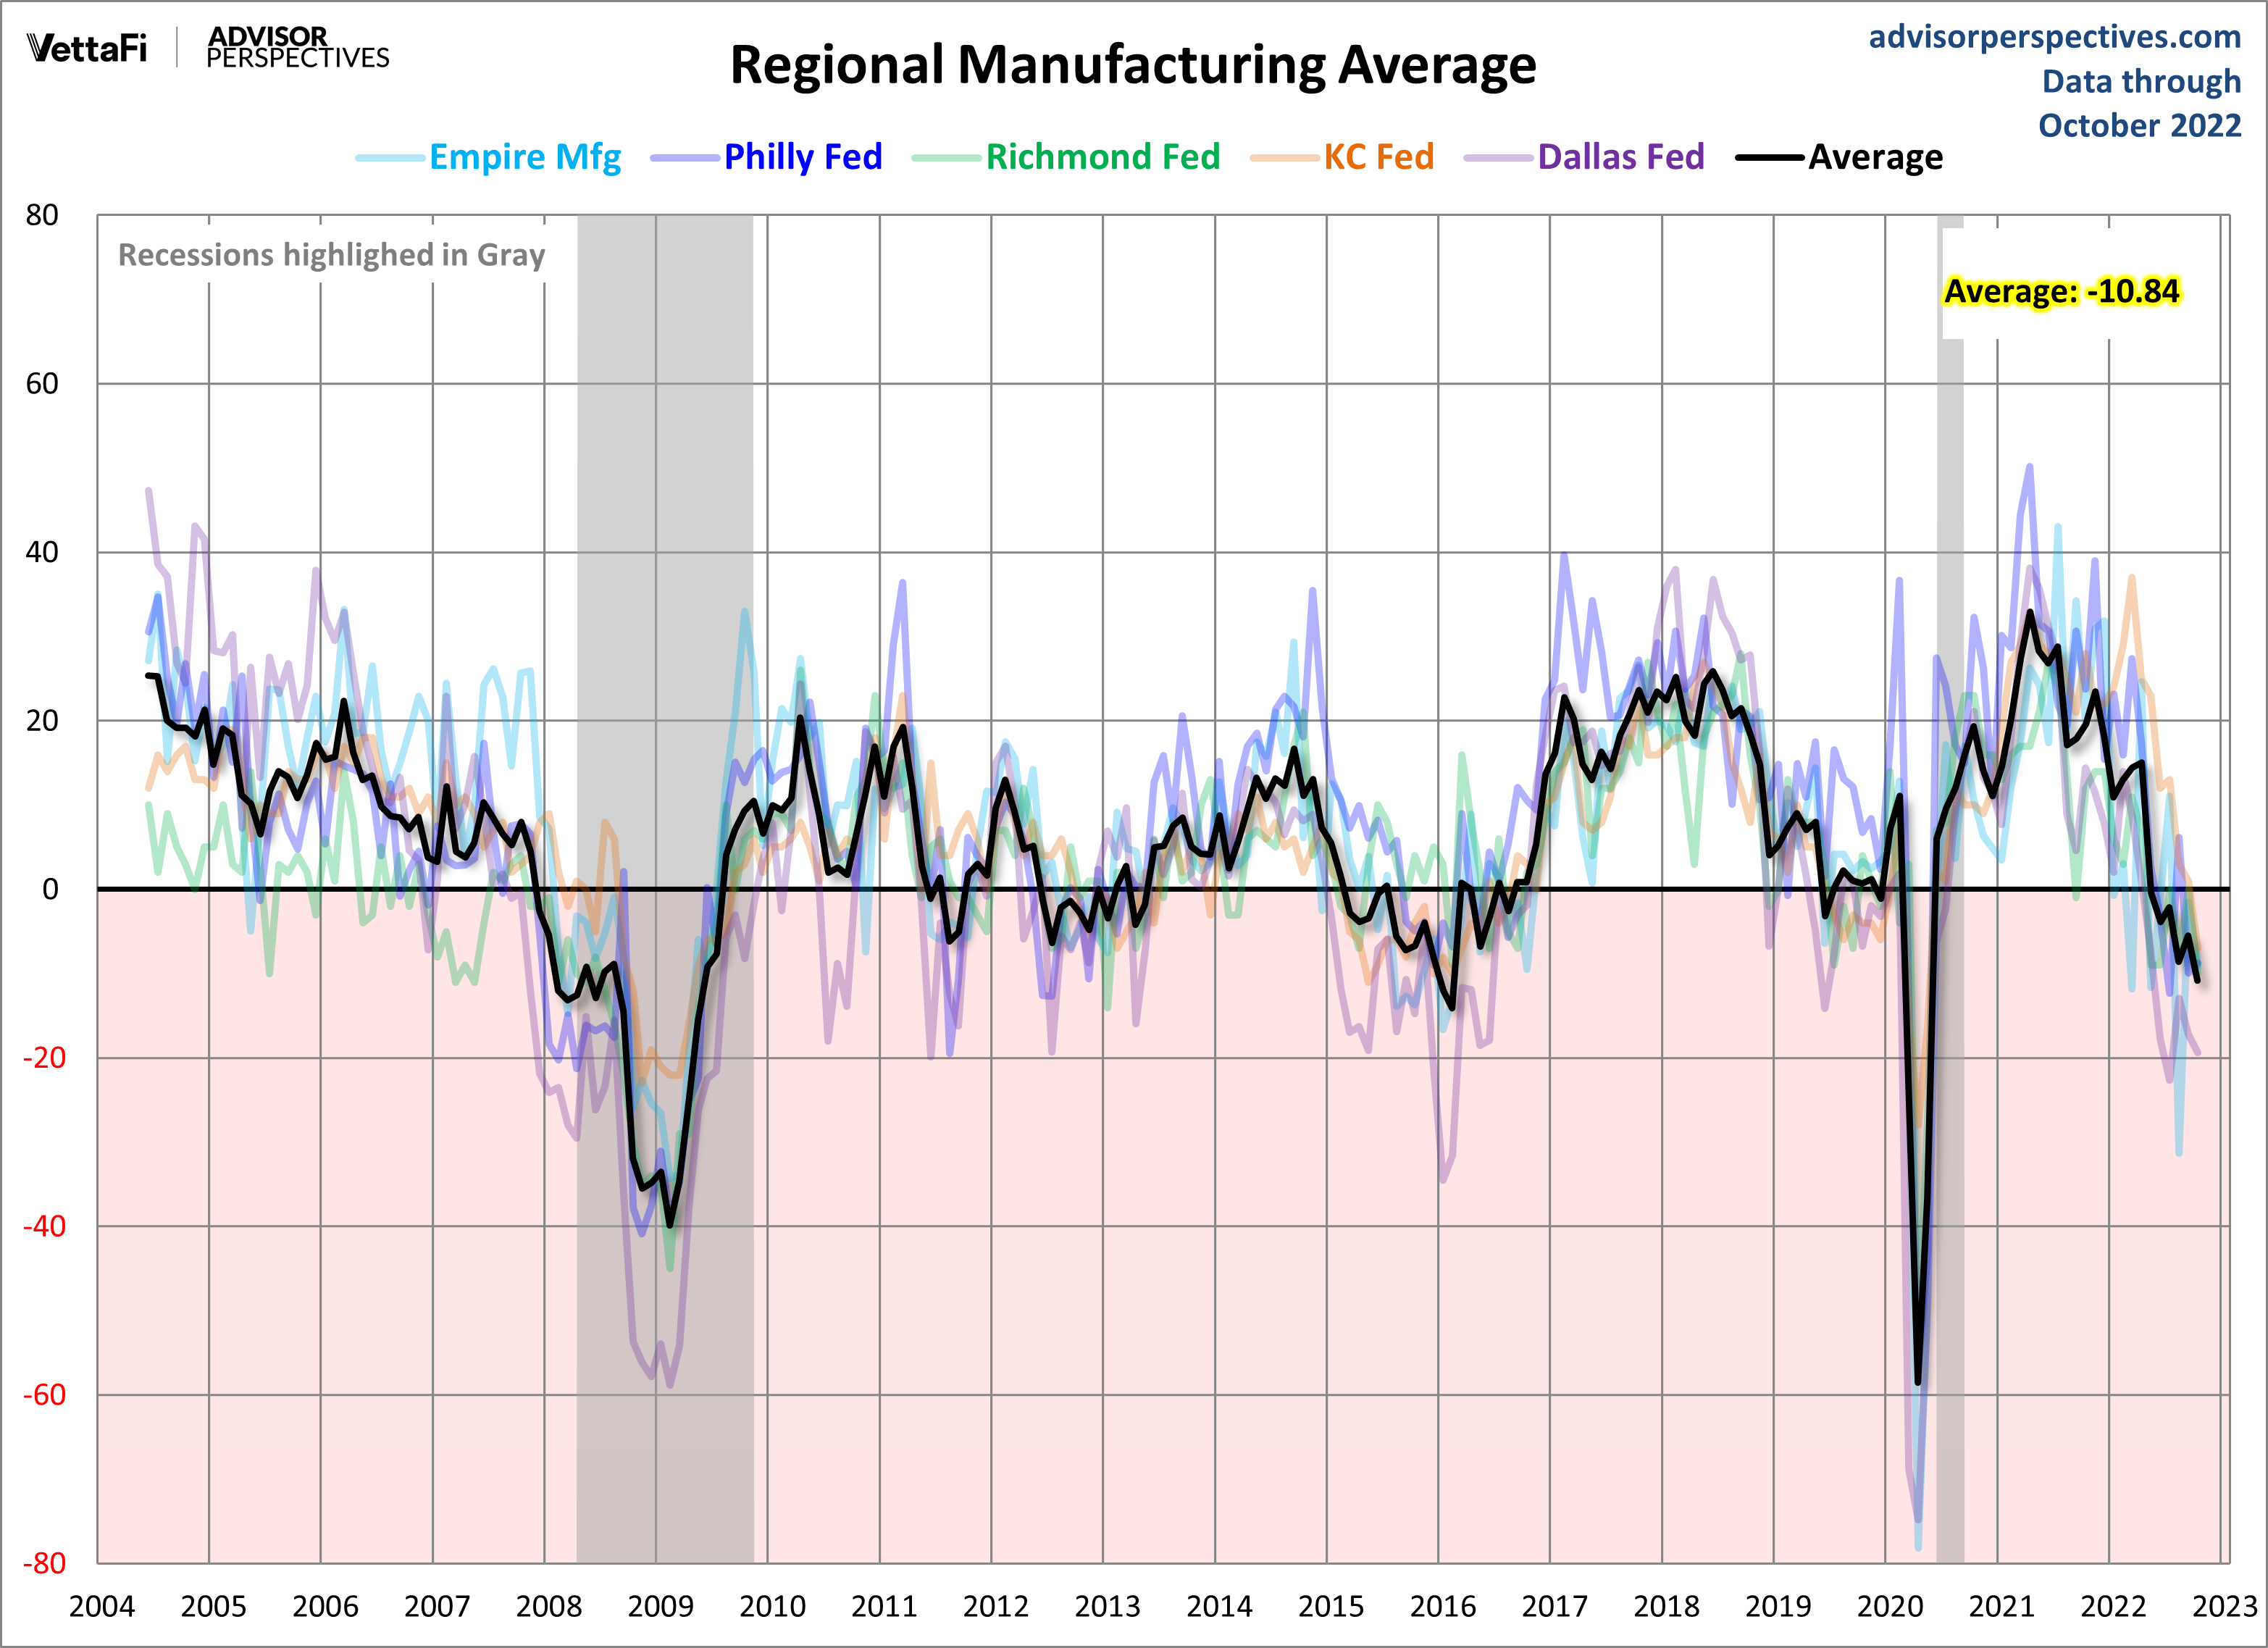
Let's compare all five Regional Manufacturing indicators. Here is a three-month moving average overlay of each since 2001 (for those with data).
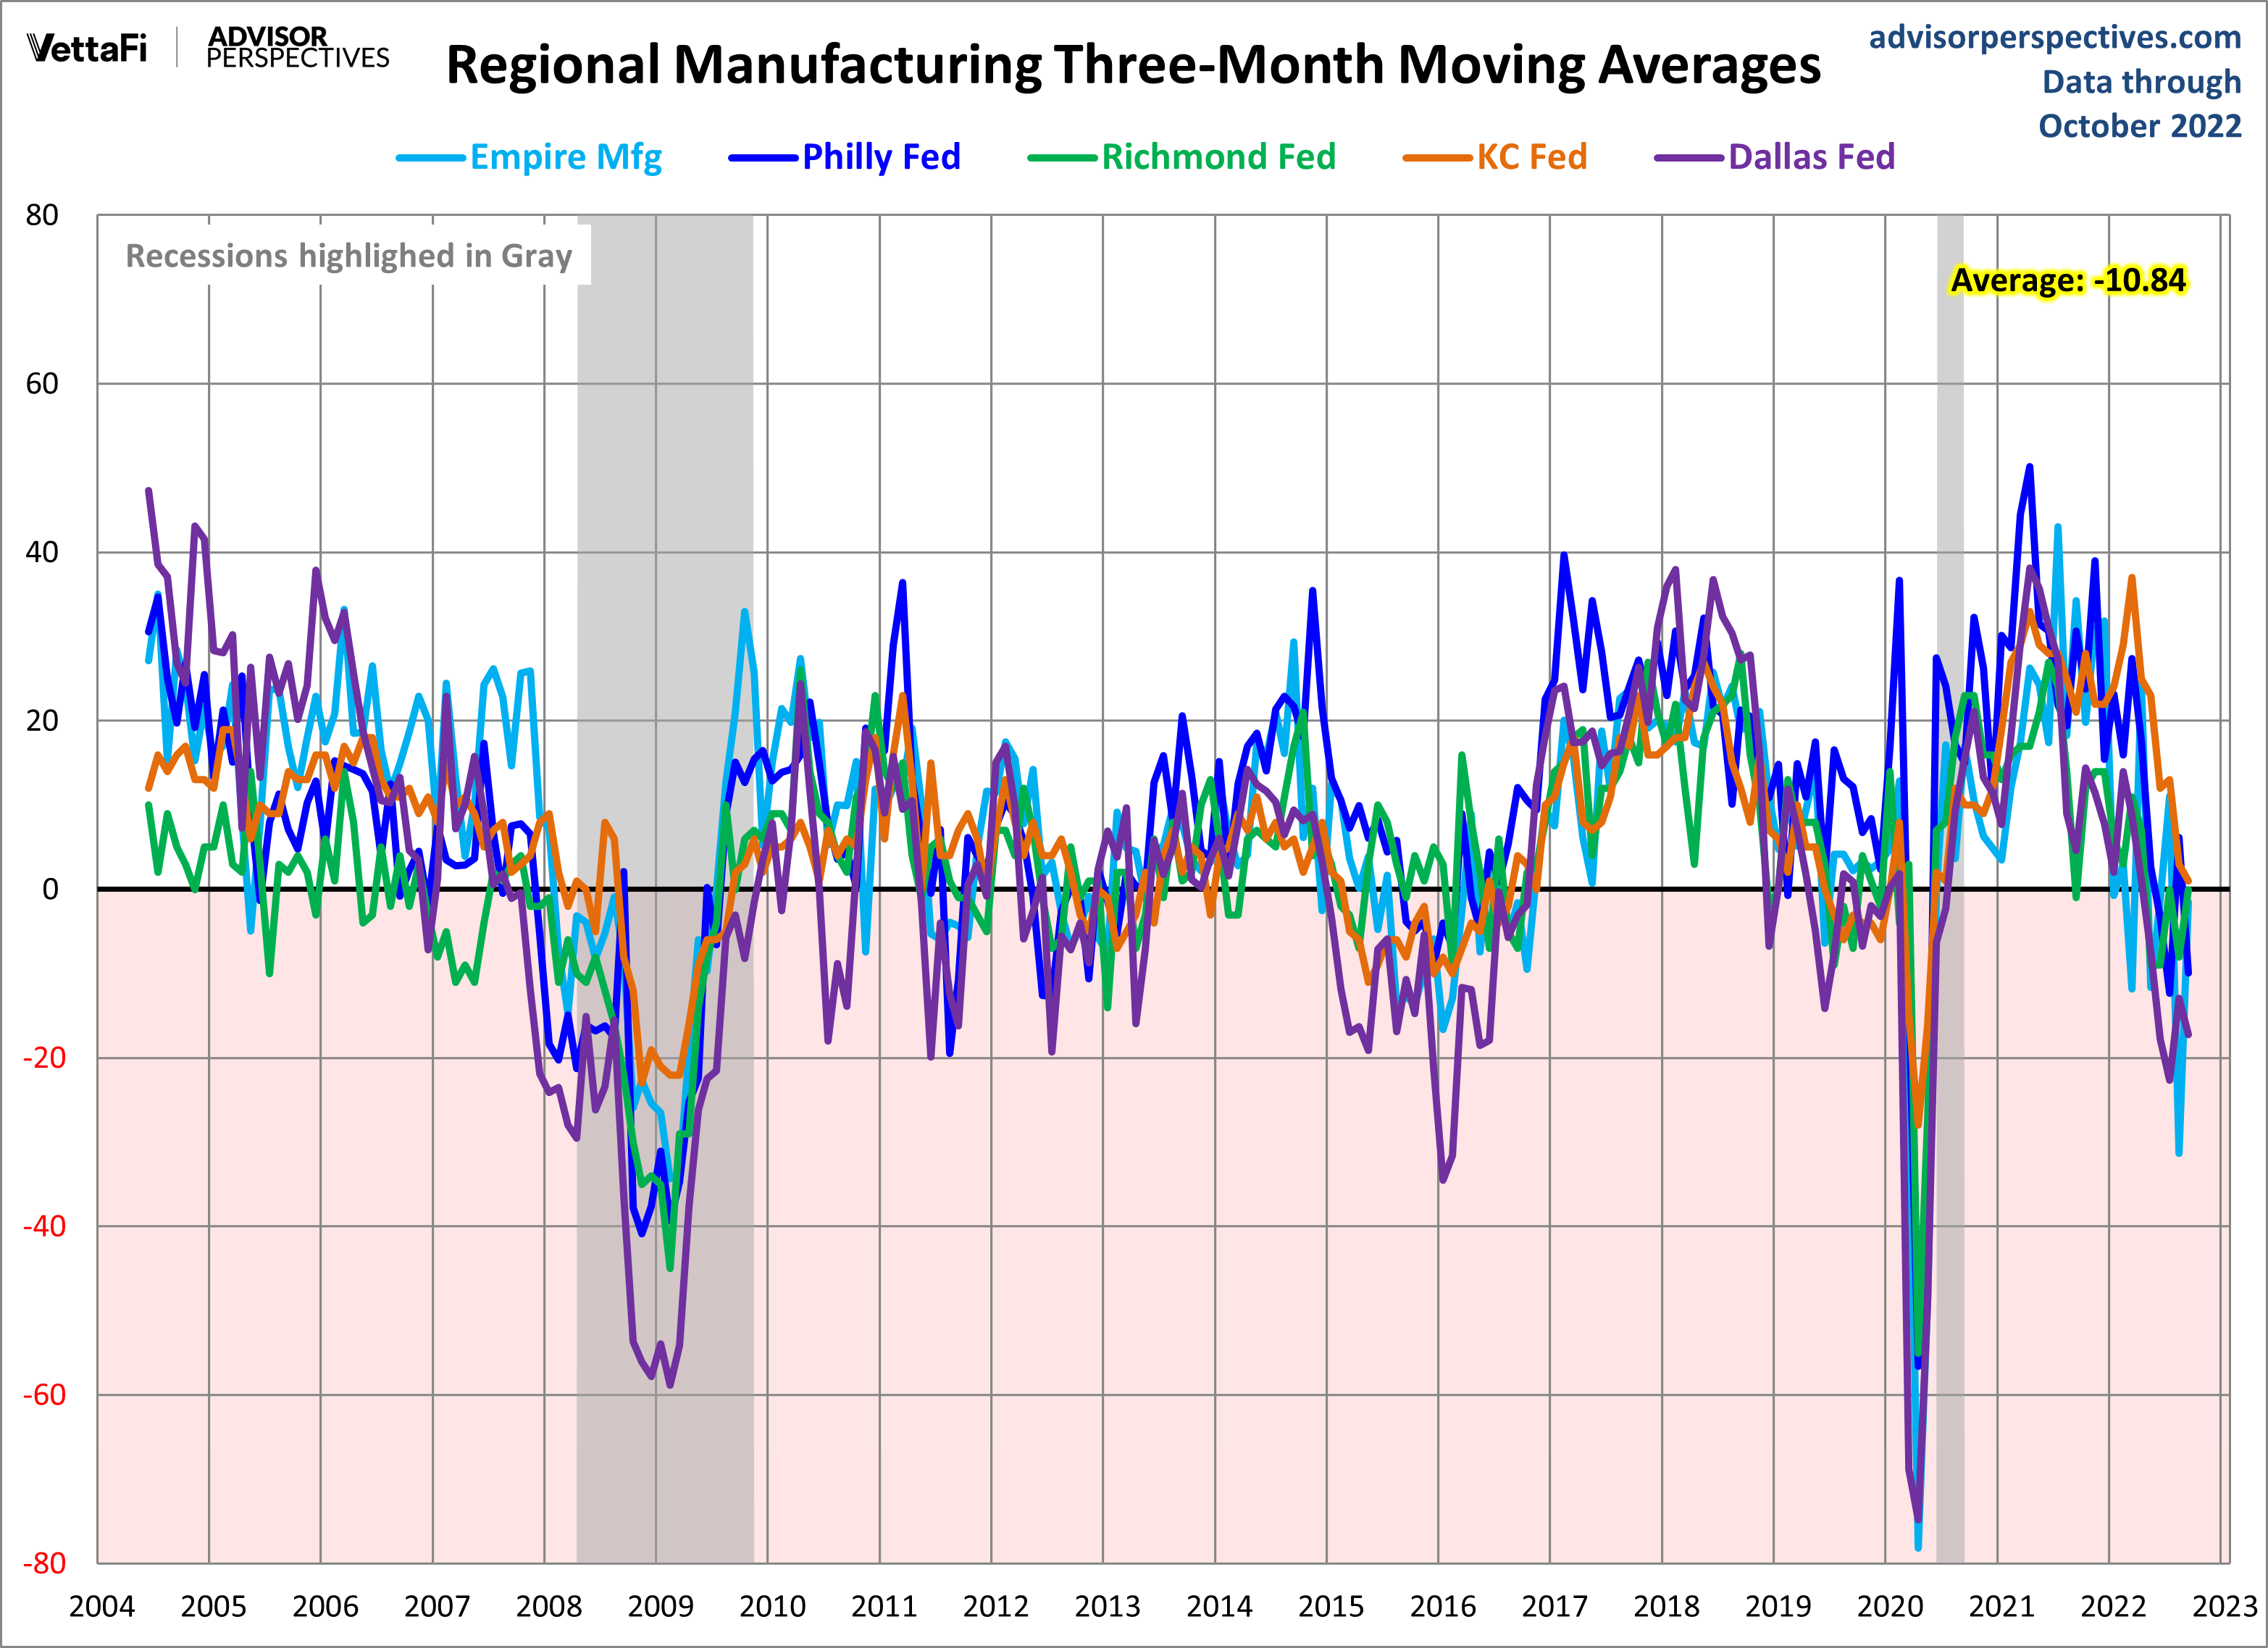
Here is the same chart including the average of the five.
More By This Author:
Philly Fed Mfg Index: Activity Continues Decline In NovemberNAHB Housing Market Index: "Builder Confidence Declines For 11 Consecutive Months"
The Big Four: Industrial Production Inches Down In October


