

BLS nonfarm payrolls by job sector.
Please consider the Bureau of Labor Statistics Monthly Payroll Report for July.
Initial Thoughts
- A gain of 187,000 looks OK but negative revisions of 110,000 wipes out any semblance of OK.
- Employment rise by 222,000 but unemployment rose by 514,000. Over half a million people wanted jobs but couldn’t find them.
- The civilian noninstitutional population is 267,213,000. Employment is 161,484,000. That means there are nearly 106 million people age 16 and older who are not working at all.
- Because of annual benchmark revisions, the way the BLS reports revisions, and the relatively small sample sizes of monthly jobs reports, we cannot, with strong confidence, suggest these reports portray an accurate picture of either jobs or employment.
Nonfarm Payrolls and Employment Levels

Employment levels and jobs data from the BLS, chart by Mish.
About those strong jobs reports: Full time employment is down by 150,000 since January of 2023.
Payrolls vs Employment Gains Since May 2022
- Nonfarm Payrolls: 4,377,000
- Employment Level: +3,185,000
- Full Time Employment: +1,446,000
- Only 45.4 percent of the employment gains for the last 15 months was full time employment.
Of the 894,000 rise in employment in January, 810,000 was due to annual benchmark revisions. And the BLS does not say what months were revised, just poof, here you go. Again, we cannot, with strong confidence, suggest these reports portray an accurate picture of either jobs or employment.
Job Report Details
- Nonfarm Payroll: +187,000 to 156,419,000 – Establishment Survey
- Civilian Non-institutional Population: +211,000 to 267,213,000
- Civilian Labor Force: +736,000 to 167,839,000 – Household Survey
- Participation Rate: +0.2 to 62.8% – Household Survey
- Employment: +222,000 to 161,484,000– Household Survey
- Unemployment: +514,000 to 6,355,000- Household Survey
- Baseline Unemployment Rate: +0.3 to 3.8% – Household Survey
- Not in Labor Force: 525,000 to 99,374,000 – Household Survey
- U-6 unemployment: +0.4 to 7.1% – Household Survey
Change in Nonfarm Payrolls

Monthly Revisions
- August 2023: The change in total nonfarm payroll employment for June was revised down by 80,000, from +185,000 to +105,000, and the change for July was revised down by 30,000, from +187,000 to +157,000. With these revisions, employment in June and July combined is 110,000 lower than previously reported.
- July 2023: The change in total nonfarm payroll employment for May was revised down by 25,000, from +306,000 to +281,000, and the change for June was revised down by 24,000, from +209,000 to +185,000. With these revisions, employment in May and June combined is 49,000 lower than previously reported.
Last month the BLS revised the net gain in June from 209,000 to 185,000. This month the BLS revised June from 185,000 to 105,000.
Expect more negative revisions,
Part-Time Jobs
- Involuntary Part-Time Work: +197,000 to 4,221,000
- Voluntary Part-Time Work: +4,000 to 21,975,000
- Total Full-Time Work: -85,000 to 134,189,000
- Total Part-Time Work: +32,000 to 27,185,000
The above numbers never total correctly due to the way the BLS makes seasonal adjustments. I list them as reported.
In July, full-time employment declined by 585,000 and this month another 85,000.
Hours and Wages
This data is frequently revised.
- Average weekly hours of all private employees rose 0.1 hour to 34.4 hours.
- Average weekly hours of all private service-providing employees was flat at 33.3 hours.
- Average weekly hours of manufacturers was flat at 40.1 hours.
An overall decline or rise of a tenth of an hour does not sound line much, but with employment at 160 million, it’s more significant than it appears at first glance.
A year ago average total private weekly hours were 34.5 hours.
Hourly Earnings
This data is also frequently revised. Here are the numbers as reported this month.
Average Hourly Earnings of All Nonfarm Workers rose $0.08 to $33.82. A year ago the average wage was $32.43. That’s a gain of 4.3%.
Average hourly earnings of Production and Nonsupervisory Workers rose $0.06 to $29.00. A year ago the average wage was $27.75. That’s a gain of 4.5%.
Year-over-year wages are finally keeping up with inflation after underperforming for many months. However, the growth in wages is now shrinking. The monthly increased for production workers in August was only 0.2 percent.
Unemployment Rate

BLS unemployment data, chart by Mish
The unemployment rate hit a 50-year low in January and April of 3.4 percent. This month it’s 3.8 percent. That’s the highest since February of 2022.
Alternative Measures of Unemployment
(Click on image to enlarge)

Table A-15 Alternative Measures of Labor, chart from BLS
Table A-15 is where one can find a better approximation of what the unemployment rate really is.
The official unemployment rate is 3.8%.
U-6 is much higher at 7.1%. Both numbers would be way higher still, were it not for millions dropping out of the labor force over the past few years.
Some of those dropping out of the labor force retired because they wanted to retire. Some dropped out over Covid fears and never returned. Still others took advantage of a strong stock market and retired early.
The rest is disability fraud, forced retirement (need for Social Security income), and discouraged workers.
Birth Death Model
Starting January 2014, I dropped the Birth/Death Model charts from this report.
The birth-death model pertains to the birth and death of corporations not individuals except by implication.
For those who follow the numbers, I retain this caution: Do not subtract the reported Birth-Death number from the reported headline number. That approach is statistically invalid.
The model is wrong at economic turning points and is also heavily revised and thus essentially useless.
Household Survey vs. Payroll Survey
- The payroll survey (sometimes called the establishment survey) is the headline jobs number. It is based on employer reporting.
- The household survey is a phone survey conducted by the BLS. It measures employment, unemployment and other factors.
If you work one hour, you are employed. If you don’t have a job and fail to look for one, you are not considered unemployed, rather, you drop out of the labor force.
Looking for job openings on Jooble or Monster or in the want ads does not count as “looking for a job”. You need an actual interview or send out a resume.
These distortions artificially lower the unemployment rate, artificially boost full-time employment, and artificially increase the payroll jobs report every month.
Goldilocks!?

Image snip and comments from Bloomberg
Expect a Long But Shallow Recession With Minimal Rise in Unemployment
Given hiring pressures and boomer retirements, Expect a Long But Shallow Recession With Minimal Unemployment Rise
Unlike many others, I expect the unemployment rate will not rise much in this recession compared to the average recession impact. Employment due to baby boomer retirement is another matter.
Job Openings and Quits are in a Steep Plunge. The Fed Will Be Pleased.

Please note Job Openings and Quits are in a Steep Plunge. The Fed Will Be Pleased.
And The Labor Leverage Ratio, a Measure of Wage Bargaining Power, Is in Retreat.
Negative Revision to 2nd Quarter GDP, Huge Discrepancy with GDI Continues
Major Discrepancy Between GDP and GDI
On August 30, I noted Negative Revision to 2nd Quarter GDP, Huge Discrepancy with GDI Continues
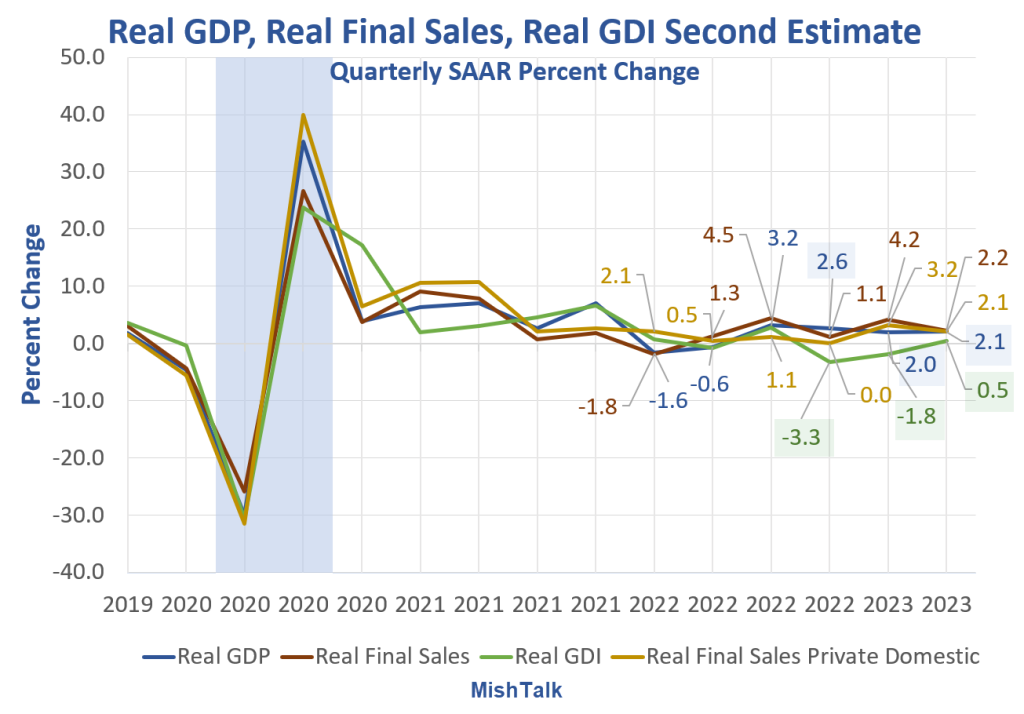
Major Discrepancy Between GDP and GDI
GDP and GDI are two measures of the same thing, one from a product perspective, the other from an income perspective. Over time they merge.
The last three quarters of GDP starting with 2022 Q4 are 2.6 percent, 2.0 percent, and 2.1 percent. The last three quarters of GDI starting with 2022 Q4 are -3.3 percent, -1.8 percent, and 0.5 percent.
GDI is still consistent with a recession starting 2022 Q4. GDP isn’t. The NBER, the official arbiter of recessions, averages the two measures. The result is inconclusive for Q4 and Q1 combined.
Don’t be surprised if the NBER declares we had a recession and it is already over. It’s happened before.
Employment data is strongly consistent with GDI, not GDP. Moreover, jobs at economic turns are one of the more heavily revised measures.
Philadelphia Fed GDPplus Measure Sure Looks Like Recession Started in 2022 Q4
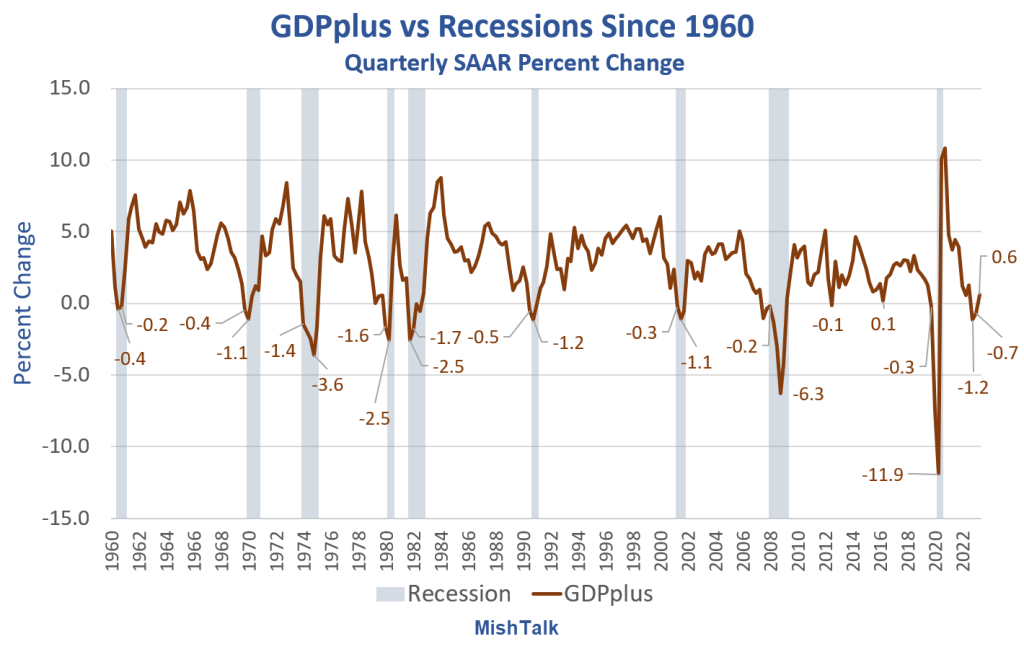
Data from Philadelphia Fed, chart by Mish
GDPplus is a measure of the quarter-over-quarter rate of growth of real output in continuously compounded annualized percentage points.
It’s a blend, but not an average, of Gross Domestic Product (GDP) and Gross Domestic Income (GDI). It is much smoother than either GDP or GDI as the above chart show.
For 2022 Q4 and 2023 Q1 the GDPplus numbers are -1.2 percent and -0.7 percent respectively.
For discussion, please see Philadelphia Fed GDPplus Measure Sure Looks Like Recession Started in 2022 Q4
In 100 percent of the cases, with no false signals, no misses, and no lead times more than two quarters, every time GDPplus had two consecutive quarters of negative growth, the economy was in recession.
On closer inspection, except for one reading of -0.1 percent, every time GDPplus went negative for even one quarter a recession soon followed.
Ignoring one barely negative print, GDPplus does not give false positives. And the lag is short compared to yield curve analysis.
The caveat is GDI and thus GDPplus are frequently revised. But the last revision was from -0.4 percent for 2023 Q1 to -0.7 percent.
This analysis strongly hints at a recession that started in 2022 Q4. Perhaps we had a recession and no one noticed. Don’t worry, there will be another one.
More By This Author:
Fed Warns of “Financial Stability Vulnerability Due To Leveraged Treasury Short PositionsConsumers Go On A Spending Spree In July, But Income Doesn’t Match
Philadelphia Fed GDPplus Measure Sure Looks Like Recession Started In 2022 Q4


Comments
Log in or sign up to join the conversation.