
Japanese Yen Price Chart: USD/JPY Breakout Trade Levels For FOMC
The Japanese Yen has continued to trade within the July opening-range against the US Dollar with the immediate focus on a break of the objective weekly range as we head into today’s Fed rate decision. These are the updated targets and invalidation levels that matter on the EUR/USD charts this week.
JAPANESE YEN PRICE CHART – USD/JPY DAILY
(Click on image to enlarge)
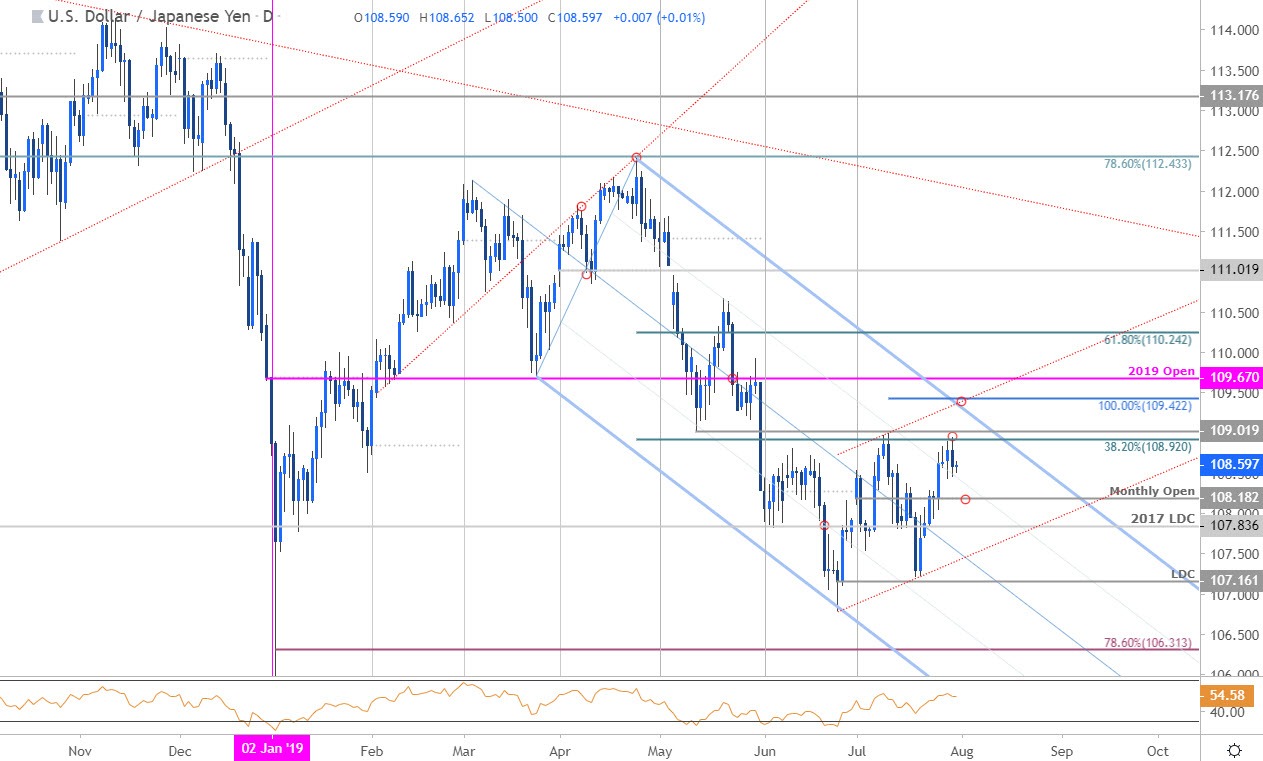
Technical Outlook: USD/JPY posted an outside-day reversal off confluence resistance at the monthly opening-range highs yesterday at 108.92-109.02 – a region defined by the 38.2% retracement of the April decline and the mid-May swing low. Note that daily RSI shows momentum largely holding between 40-60 since the start of the month and may offer further conviction on a directional bias once we clear the July range.
Monthly open support rests at 108.18 backed closely nu the 2017 low-day close at 107.83 and basic channel support. Ultimately a break below the yearly low-day close at 107.16 would be needed to mark resumption of the broader downtrend. A topside breach looks to challenge subsequent resistance targets at the 100% ext at 109.42 and the objective yearly open at 109.67- both levels of interest for possible exhaustion IF reached.
JAPANESE YEN PRICE CHART – USD/JPY 120MIN
(Click on image to enlarge)
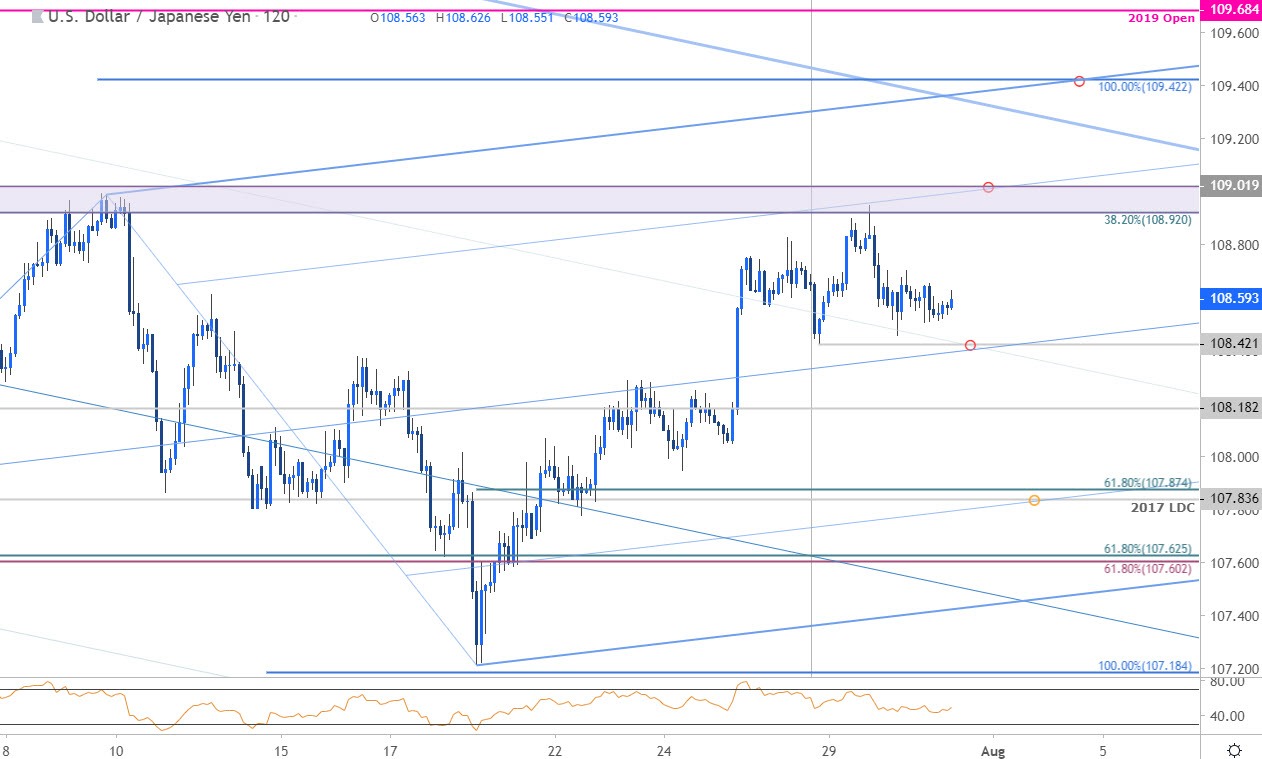
Notes: A closer look at price action shows USD/JPY trading within the confines of an ascending pitchfork formation extending off the June / July lows – note that the weekly range is now defined by yesterday’s reversal candle just below confluence resistance at 108.92-109.02. Initial support rests with median-line / Sunday low at 108.42- a break below this level exposes 108.18 and 107.84/87 – look for a bigger reaction there IF reached.
Bottom Line: USD/JPY has set a clean weekly opening-range just below resistance heading into the FOMC interest rate decision later today. From a trading standpoint, I favor fading a spike higher but at the end of the day, look for the break of this range for guidance. Keep in mind we still have US Non-Farm Payrolls (NFP) on tap into the August open- stay nimble.
USD/JPY TRADER SENTIMENT
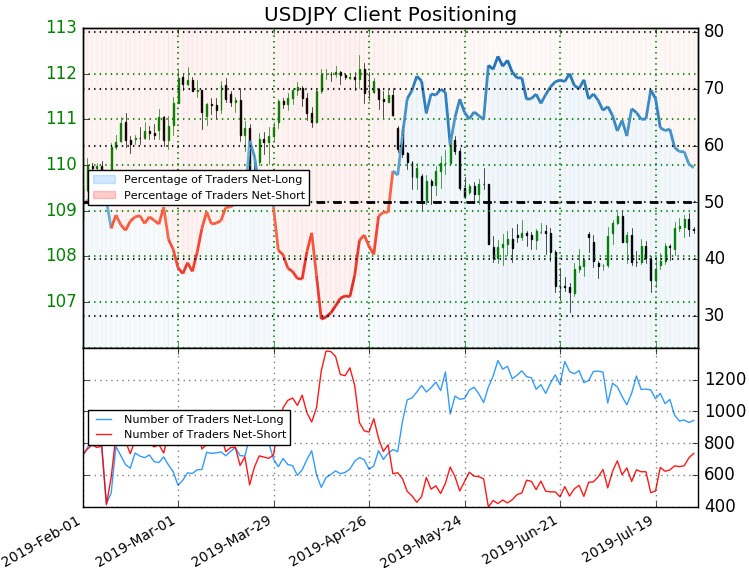
- A summary of IG Client Sentiment shows traders are net-long USD/JPY - the ratio stands at +1.28 (56.1% of traders are long) – bearish reading
- Traders have remained net-long since May 3rd; price has moved 3.0% lower since then
- Long positions are 2.4% lower than yesterday and 12.8% lower from last week
- Short positions are 9.7% higher than yesterday and 11.3% higher from last week
- We typically take a contrarian view to crowd sentiment, and the fact traders are net-long suggests USD/JPY prices may continue to fall. Yet traders are less net-long than yesterday & compared with last week and the recent changes in sentiment warn that the current USD/JPY price trend may soon reverse higher despite the fact traders remain net-long.

Comments
 No Thumbs up yet!

