
It May Be Time To Back Up Before Next Leg Higher In The Market
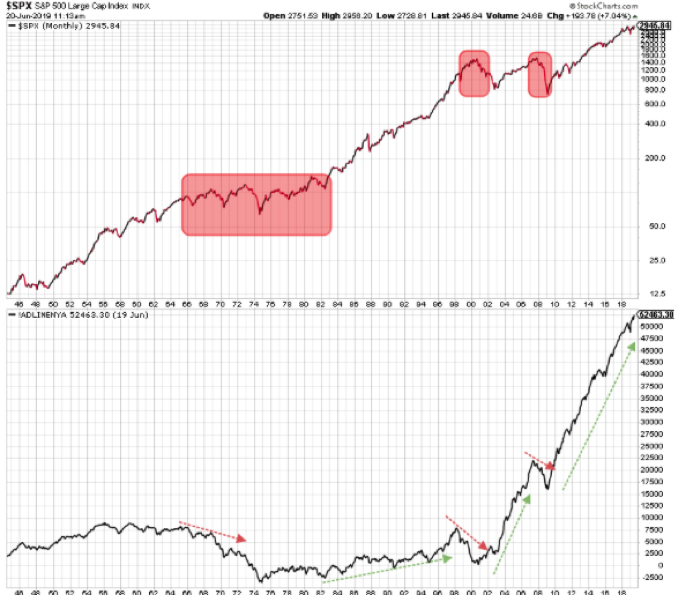
In the week that was, the S&P 500 (SPX) found itself another leg higher, capturing new record-level highs and nearly hitting the 3,000 level. This was something I had foreseen as being the greater probability based on historic precedence. Remember that the NYSE A/D line had been setting record highs in the previous week, which usually sets the stage for future gains in the S&P 500 or broader market.
Below is what Finom Group (for who I am employed) suggested in last week’s Research Report:
“What may be relevant near-term for traders to consider is that 3,000 could be achieved in the coming week or weeks. As the level may coincide with the heart of earnings season, it may prove a pivotal pullback or pause point for the market as well. Keeping in mind the 3,000-level, if achieved in the next couple of weeks, our pullback or pause assumption is also predicated upon some caution amongst investors ahead of the July FOMC meeting.”
For the holiday-shortened trading week, the Dow Jones Industrial Average (DJIA) rose 1.2%, the S&P 500 rose 1.7%, and the NASDAQ (NDX) rose 1.9 percent.
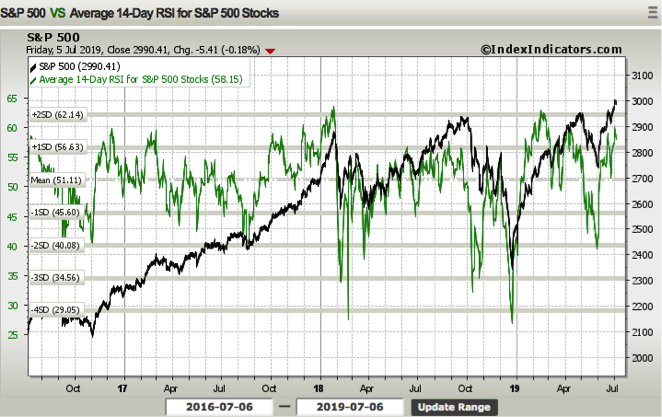
While the S&P 500 remains near the high-watermark level of 3,000 and having set multiple record highs in 2019, the 14-day RSI remains in neutral territory, suggesting the current rally has not been exhausted.
Additionally, as of Friday's closing, 75% of stocks in the S&P 500 are now above their 200-day moving average, the most since February 2018. This suggests the market's rise has been broad-based over the course of the first 6 months of the calendar year, but may also be very near a temporary peak and subsequent retracement.

To reiterate my bull market/SPX thesis for 2019, this was centered on the acronym EFG: Earnings growth, FOMC, and Global Economy. While the global economy has certainly sputtered, the U.S. economy has remained resilient in the face of slowing from above trend-growth to trend-growth. Investors should recognize that we identify with 4 different qualifications of economic growth as follows:
- Above trend-growth
- Trend-growth
- Below trend-growth
- Economic recession.
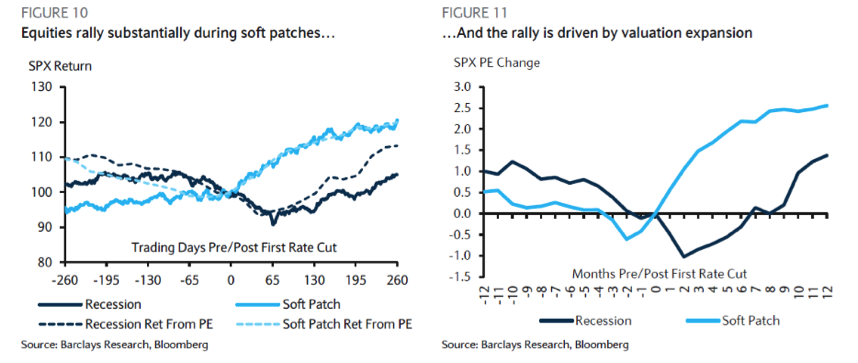
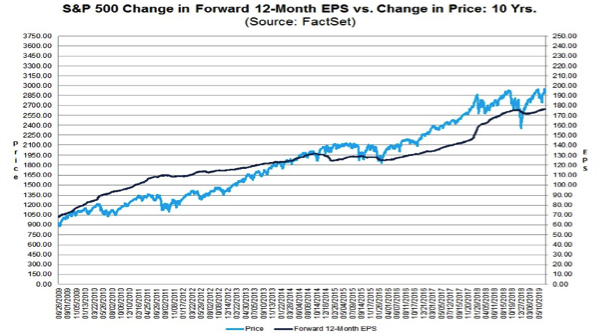
As we look forward to the back half of the year, earnings growth will become increasingly important as much of the current equity market gains are coming via multiple expansion.

I recognize the fact that multiple expansion is taking place in the face of slowing economic and earnings growth that has not expressed a recession, but a soft patch. (See charts below)
With this in mind, multiple expansion can only last so long and push the market so high before either earnings move higher to validate the PE expansion or the market rationalizes for earnings declines to continue and by faltering. This could produce a market correction if not a bear market if earnings don’t perform to FY19 expectations. But with the first half of the year behind us…
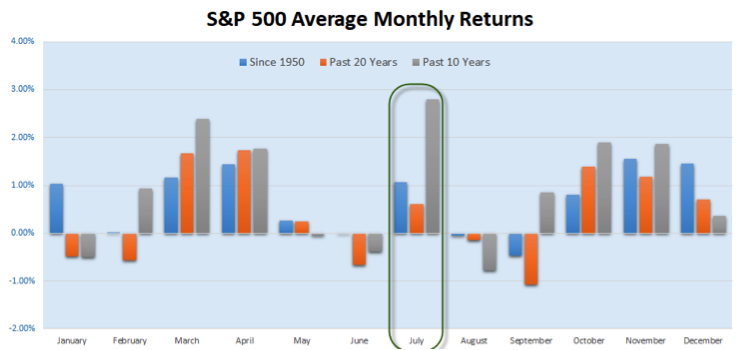
Welcome to the month of July traders, which marks the halfway point in the trading year. Historically, the summer months are tough for stocks. But July tends to see a summertime bounce. In fact, over the past 10 years, it has been the strongest month of the year for the S&P 500. Least we did not forget, however, this year comes after the best June since 1955.
The S&P 500 rallied by more than 17% in the first six months of the year, the 10th time in the past seven decades that it has gained more than 15% over that stretch. In those years, the index has pulled back an average 12.1% in the second half, and by as much as 34% during the market crash of 1987.
Unfortunately, the greater the gains from January to June, the higher the chances of a sharp pullback in the second half of the year, LPL Financial’s Ryan Detrick told CNBC’s “Trading Nation ” this past week.

“Where it gets a little worrisome is when you’re up 15% for the year or more, so really stretched like we were, that’s when … the average correction peak to trough [is] about 12 percent.”
In analyzing the 2019 bull market and subsequent climb from the December 2018 lows, we are forced to recognize the strong V-shaped recovery that could result in a 20%+ gain for the benchmark index by year’s end. As shown in the chart below, it is interesting that the S&P 500 hasn’t gained more than 20% in any one year for 5 consecutive years. Only once since 1950 did it go more than 5 years in a row without gaining 20%, thus if this pattern continues we very well might get to 20% in 2019.

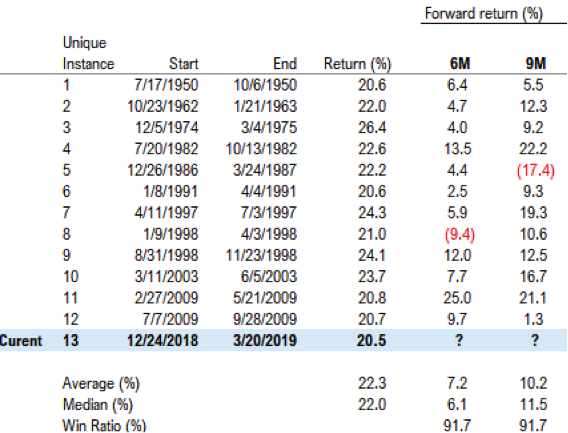
Moreover, here is something else to possibly join with the above chart and consideration, the S&P 500 actually rose more than 20% in just 3 months recently. The chart below (Thomas Lee of FundStrat) represents the 12 times the market moved 20% in just 3 months since 1950. Notice that 11 of 12 times, the 6 months and 9 months saw further gains, averaging 10 percent. This implies 2019 is a 20%-plus year, akin to 2009 or 1995. Of course, history doesn’t always repeat, but it’s certainly worth noting and considering.
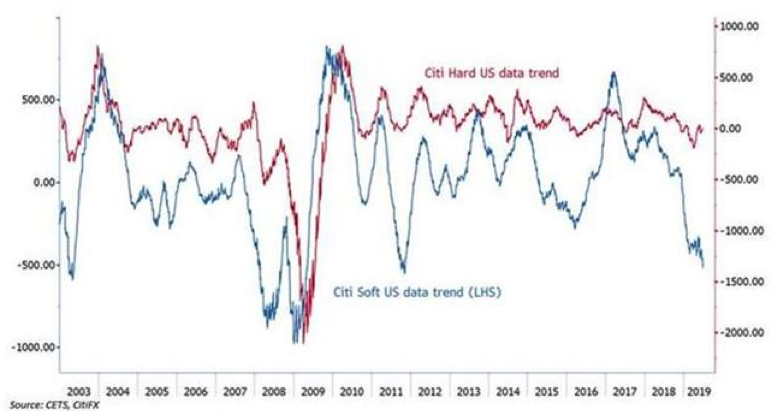
Will the S&P 500 achieve that 20% gain from the beginning of the year here in 2019 remains to be seen? What I can suggest is that it will depend on improving the global economic force and more favorable domestic economic data going forward, which ultimately bleeds into corporate profits. Before we begin to review our economic data releases for the week that was, one thing has been consistent throughout 2019 and is displayed in the following chart:
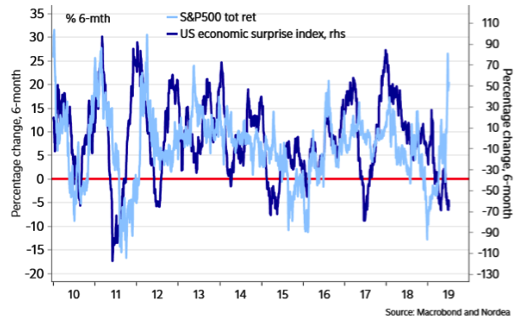
This divergence between the S&P 500 and the U.S. economic surprise index reflects how much stock-market bulls are relying on global growth concerns to push the Federal Reserve to cut rates and, in turn, prolong the U.S. economic expansion, suggests Nordea Markets.
“Despite a consistent weakening of the manufacturing cycle, equities have been on a tear. Comparing U.S. equity market performance over the past six months with U.S. macro surprises reveals the largest divergence ever,” wrote analysts at Nordea Markets, in a research note.
Lastly but not least, for the coming week, the S&P 500 has a weekly expected move of just $33/points and with the VIX falling nearly 12% in the past trading week.

This is a sharp downturn in the expected move after last week's achievement of the $52/points weekly expected move.
Yield Curves & Fed Rate Cut Chatter
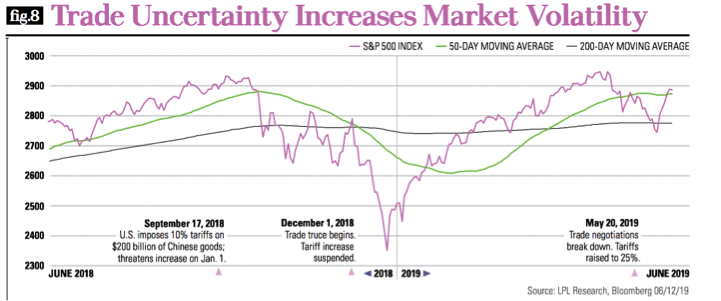
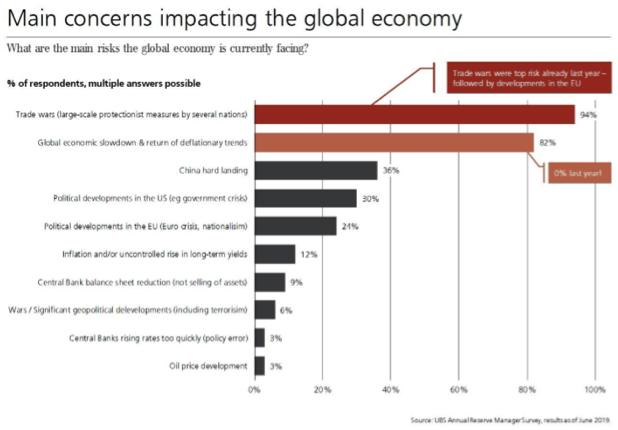
Several market risks are still present, including the geopolitical environment, the possibility of failed trade negotiations, and a potential monetary policy mistake. These risks could fuel periodic bouts of volatility, with trade central to my outlook.
J.P. Morgan has told clients to build up a balanced portfolio as the outcome of the trade dispute between the world’s two largest economies remains up in the air.
The asset manager’s global market strategist Mike Bell said the dilemma for investors was whether prospective rate cuts would extend the economic cycle or be “too little too late”, leading to an economic downturn.
“A large part of the answer to that dilemma unfortunately lies with what happens with trade where there is very limited visibility.”
Recent economic data, including declining U.S. business surveys and deteriorating global manufacturing surveys, wasn’t painting a positive picture, Bell said, but the market has been willing to overlook that due to the prospect of rate cuts.
The advice to clients has been to avoid any big overweight or underweight positions on stocks and low quality, expensive stocks while focusing on equities likely to outperform if economic data continues to weaken.
Treasuries could also provide some hedge to equities, the asset manager said, or other traditional safe havens such as the Japanese yen and gold.
“It is a very difficult environment for investing where big overweight or underweight positions, while uncertainty lasts, are a risk. It doesn’t feel very satisfactory because it feels like sitting on the fence — sometimes if your conviction is lower it makes sense to reflect that in portfolios, rather than continue to run the same level of overweights to equities as you would have done when the data was stronger and the political risk was less.”
The falling cost of capital is causing markets to re-price assets, the result might be a continued move higher as investors “question where neutral rates are likely to settle,” Roger Jones, head of equities at London & Capital, told CNBC. Jones speculated that we would see U.S. 10-Year yields of 1.5 percent.
“The stock market has been quick to look through the growth slowdown but this could result in a reversal in the positive correlations between bonds and equities,” Jones added.
If the growth environment doesn’t stabilize, there could be significant earnings disappointments for equities, Jones hypothesized, adding that it is “unlikely” that the growth moderation that has been seen since the fourth quarter of 2018 is entirely down to trade wars.
“Thus, the danger is that the industrial slowdown impacts the labor markets and causes a more damaging consumer slowdown. Many investors are now justifiably concerned about the inverted yield curve and the implication this has for growth.”
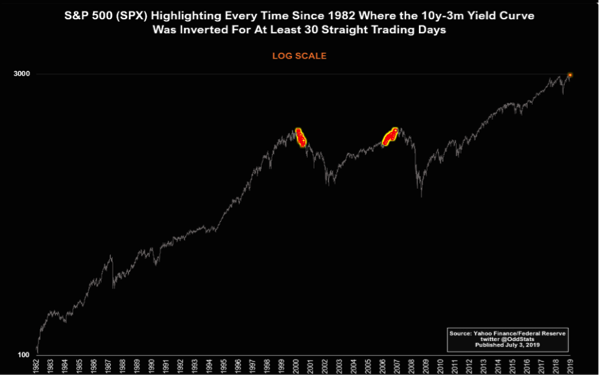
Speaking of the Treasury yield curve, the 10-yr./3-month yield curve has remained inverted for 30 straight days. Since 1982, this has only happened two other times, as depicted in the chart below from OddStats.
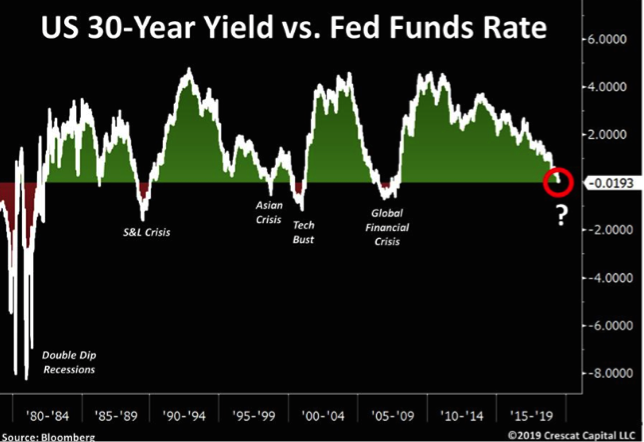
The latest yield curve inversion concern is actually happening as it relates to the Fed funds rate. The 30-year yield inverted vs. the Fed Fund rate on July 3rd, but shortly after the Nonfarm Payroll data for June was released, the curve has since un-inverted.
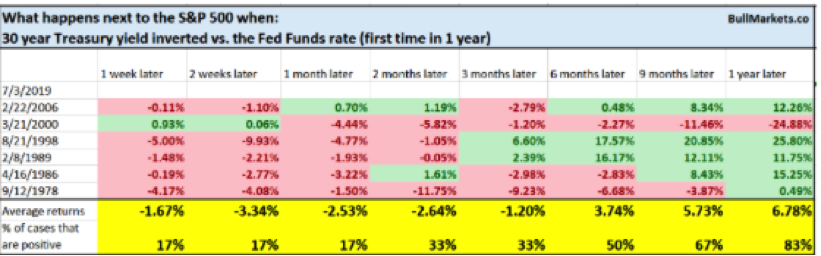
While it is a short-term bearish factor & late-cycle sign, more often than not the S&P 500 moves higher over the next year when this aspect of the bond market inverts with the Fed Funds rate. (Table from Troy Bombardia)
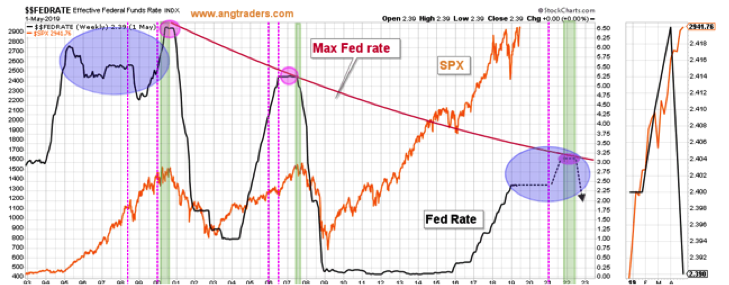
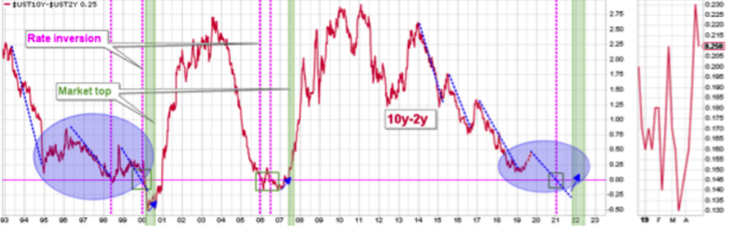
The most important rate differential is the 10y-2y rate, and this differential profile is increasingly similar to the pattern that started in 1995. That pattern coincided with the Fed holding the funds rate steady-to-lower for four years and with the SPX ripping higher the whole time. From this perspective, it would be reasonable to expect an inversion of this rate pair in the middle of 2021 and the closest date for a recession would be 6-months later in 2022 (purple colored-areas in chart below).
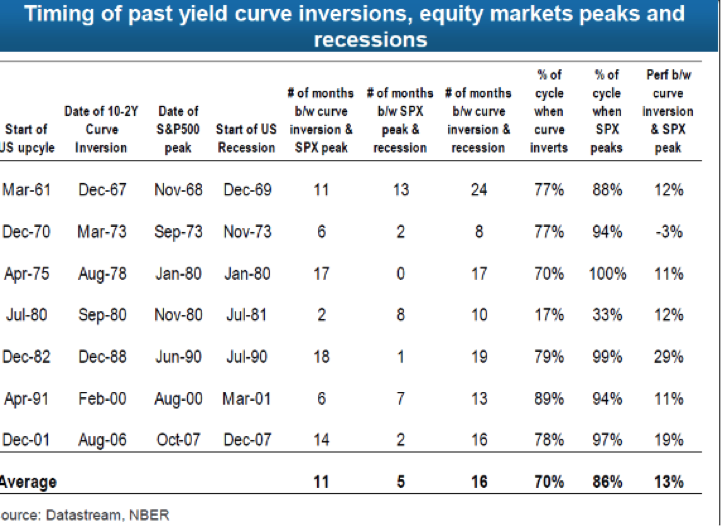
With respect to the 2s/10s inverting in the future, which is inevitable, here is a table that identifies the timing of past yield curve inversions, market peaks, and recessions. What we can see from the table below is that the average number of months from the yield curve inversion to a recession is 16 months.
The only thing left for present yield curve conditions and Fed funds rate to mirror the 1995 analogue is for the Fed to begin cutting rates. In its semi-annual report to Congress, the Fed on Friday repeated its pledge to “act as appropriate” to sustain the economic expansion, with possible interest rate cuts in the coming months, but notably said the jobs market had “continued to strengthen” so far this year, and described recent weak inflation as due to “transitory influences.”
Some policymakers think a rate cut could lift inflation expectations, reducing chances of more drastic rate cuts being needed later. With rates at 2.25%-2.50%, policymakers have less room to cut before they resort to unconventional measures. Goldman Sachs is of the opinion that the Fed will indeed cut rates, even with the latest strength in the BLS labor and employment report.
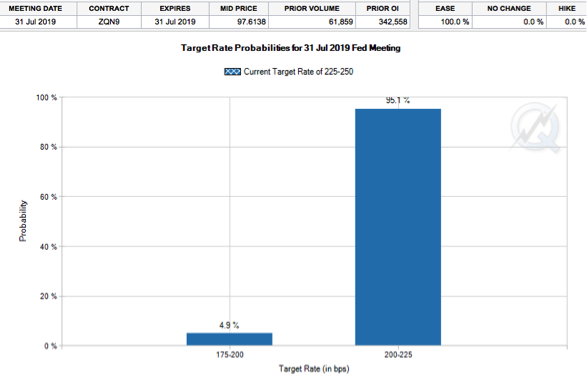
“We see a 75% chance of a rate cut at the July FOMC meeting. Within the expectations, we see a 60% chance of a 25 bps cut and a 15% chance of a 50 bps cut with a 25% chance of no cut.”
Goldman Sachs is not alone in its rate cut expectations. In fact, count on those rate cuts and another burst higher for stocks this year, says Barclays strategists, who see a “mini-bubble” ahead for the S&P 500 that could take it all the way to 3,260. They base that gung-ho attitude on the recent trade truce between Trump and China’s leader and a cease-fire they see sticking around as the 2020 presidential election looms.
A team of strategists led by Maneesh S. Deshpande told clients they now “assign a 65% probability to a ‘melt-up/mini bubble’ scenario,’” which could take the S&P some 8% higher than it is now.
Deshpande and co. see no recession on the horizon, but plenty of weakness for global manufacturing, which they say the Fed will want to try to get ahead of with policy easing.
Taking into consideration the Fed’s dual mandate of price stability/inflation and maximum employment, we are also forced to consider the Fed’s actual statements on the global economy. The Fed has become increasingly aware, as indicated in its monthly statements, of the weakening global economy as measured through various PMIs around the world, even domestically with the weakness in the ISM manufacturing data.
Ahead of Powell's semi-annual Humphrey Hawkins testimony before Congress on Wednesday and Thursday of next week, the Fed has published its Monetary Policy Report.
"Consumer price inflation, as measured by the 12-month change in the price index for personal consumption expenditures, moved down from a little above the FOMC’s objective of 2 percent in the middle of last year to a rate of 1.5 percent in May. The 12-month measure of inflation that excludes food and energy items (so-called core inflation), which historically has been a better indicator than the overall figure of where inflation will be in the future, was 1.6 percent in May—down from a rate of 2 percent from a year ago. However these year-over-year declines mainly reflect soft readings in the monthly price data earlier this year, which appear to reflect transitory influences. Survey-based measures of longer run inflation expectations are little changed, while market-based measures of inflation compensation have declined recently to levels close to or below the low levels seen late last year.”
Despite again noting that lack of inflation may be "transitory", the Fed reiterated its openness to cutting interest rates to extend the longest U.S. economic expansion on record while noting that the pace of growth had slowed in the second quarter of 2019.
“Data for the second quarter suggest a moderation in GDP growth -- despite a pickup in consumption -- as the contributions from net exports and inventories reverse and the impetus from business investment wanes further."
The report reiterated wording from the June FOMC statement saying officials would closely monitor incoming data and “act as appropriate to sustain the expansion.”
The report also highlighted a significant weakening in global trade growth and manufacturing since 2017 "even as growth in services has held up.
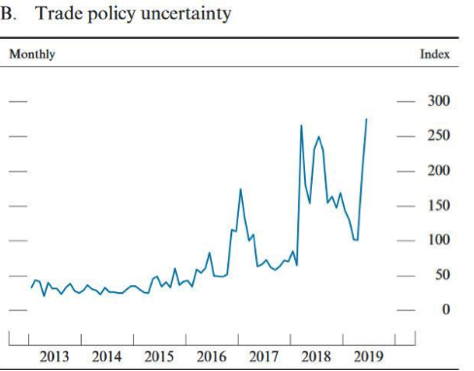
"Trade policy developments appear to have lowered trade flows to some extent, while uncertainty surrounding trade policy may be weighing on investment."
"After slowing in 2018, foreign economic growth appears to have stabilized in the first half of the year, but at a restrained pace. While aggregate activity in the advanced foreign economies (AFEs) increased slowly from the soft patch of late last year, activity in emerging Asia generally struggled to gain a solid footing, and several Latin American economies continued to underperform. Growth abroad has been held down in part by a slowdown in the manufacturing sector against the backdrop of softening global trade flows. "
While a trade truce is the current state of affairs, the Fed has seen in the past just how quickly a truce can move to escalation and without material warning. With all that has been positioned ahead of the Fed’s testimony before Congress this week, I remain of the opinion that a 25 bps rate cut in July is the base case outcome near-term on rates. Despite a strong Nonfarm Payroll headline number for the month of June, Fed Fund Futures still align with a rate cut in July as well.
While the case is pretty strong for what would be recognized as an “insurance” rate cut rather than a “recession” rate cut, not all Fed members are in favor of a cut just yet. Loretta Mester of the Cleveland Fed desires to see more data before moving to cut. She discussed the subject matter in a recent 15-minute interview on Bloomberg Television. It’s also important to denote that Mester is not a voting member of the FOMC in 2019.

Economic Data
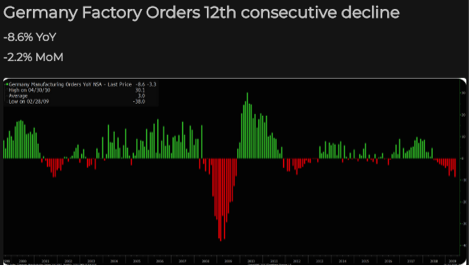
In terms of economic data for last week, it was largely disappointing and mixed on Friday. German manufacturing orders fell more than expected in May, adding more weight to the suggestion that global economic growth is moving to a slower lane in Europe's largest economy. Manufacturing orders fell by 2.2% in May on the month, in adjusted terms, the German economics ministry said Friday, while the decline was more pronounced in annual terms, down 8.6 percent.
The biggest economic data point last week, arguably, was the Nonfarm Payroll report delivered on Friday. Here’s what analysts were projecting ahead of the release.
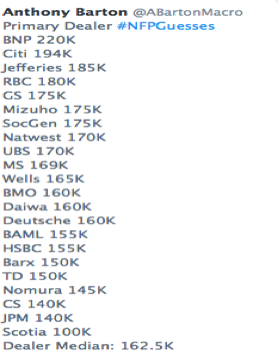
The U.S. added a robust 224,000 new jobs in June, rebounding from a recent lull and calming worries about the health of an economy now entering a record 11th year of expansion. The increase in new jobs easily beat the 170,000 forecast of economists polled by MarketWatch.
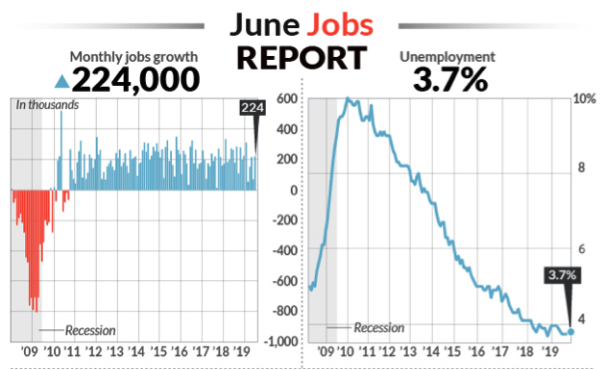
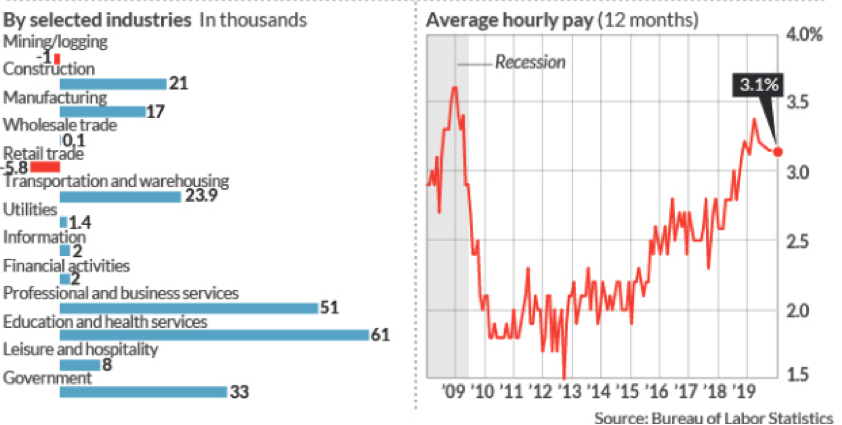
The strong gains in June were slightly offset by downward revisions to the previous estimates for job growth in April and May by 11,000. The net effect is that the BLS now believes just over 1 million jobs were added in the first half of 2019, for an average increase of 172,000 jobs each month.
The average wage paid to American workers rose 6 cents to $27.90 an hour. The 12-month rate of hourly wage gains was unchanged at 3.1%.
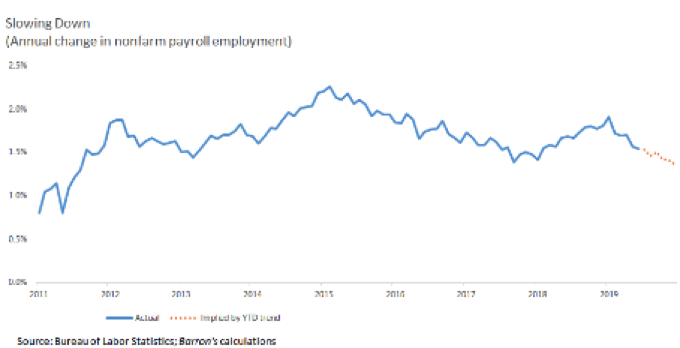
The current rate of job growth is significantly slower than the robust rate of job growth in the first six months of 2018, when the economy added 1.4 million jobs on a seasonally-adjusted basis, or about 235,000 a month. If current growth rates persist, about 2.1 million more Americans will have jobs at the end of 2019 than at the end of 2018 and the employment-growth rate would be about 1.4%. By comparison, the number of Americans with jobs rose by 2.7 million between the end of 2017 and the end of 2018, with a growth rate of about 1.8 percent.
The number of persons working part-time for economic reasons decreased in June to 4.347 million from 4.355 million in May. The number of persons working part-time for economic reason has been generally trending down.
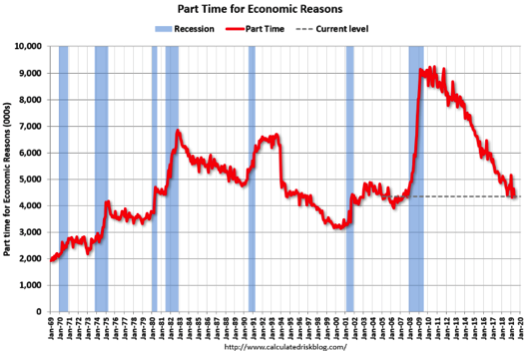
This underemployment indicator had been hovering around 3% in the second half of 2018, down from about 6.5% in 2009-2010. This measure of underemployment was under 2.5% in 1999-2001. It was extremely volatile in January and February, likely due to the combined impact of the government shutdown and the polar vortex, but was anchored to the 3% level since last summer. The most recent figures suggest this measure of underemployment may be dropping: over the past three months, the average has been 2.8%, the lowest level since 2006.
As it pertains to the strength of the June Payroll report, investors rescinded much of the probability for a 50 bps rate cut for the month of July. If any future economic data comes out favorable, expect the media to profile the rate cut expectations as offsides.
“I don’t see the Fed changing what they’ll do based on one jobs report,” JJ Kinahan, chief market strategist at TD Ameritrade, told MarketWatch. “The market says the probabilities of a rate cut are 100%. The Fed has been backed into a corner because expectations are so high.”
Kinahan added, however, that the overall strength of the jobs market, as evidenced again by Friday’s report, could cause the Fed to just cut rates once, and then delay the timing of the next cut to get a better sense of the pace of the U.S. economic slowdown.
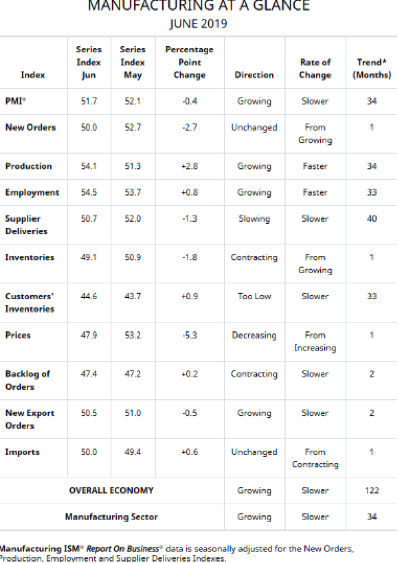
One of the more “in focus” data releases for the past trading week was also the ISM manufacturing index report. The Institute for Supply Management published its monthly Manufacturing Report for June. The latest headline Purchasing Managers Index (PMI) was 51.7 percent, a decrease of 0.4 percent from 52.1 the previous month.
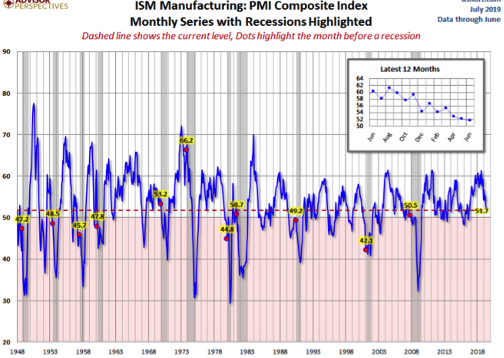
The slowing manufacturing sector soft data has not been unexpected, as the negative sentiment from the ongoing trade feud and threatened Mexico tariffs abruptly halted manufacturing activity since the month of May. Here are the key takeaways, nonetheless, from the latest ISM report:
“The June PMI® registered 51.7 percent, a decrease of 0.4 percentage point from the May reading of 52.1 percent. The New Orders Index registered 50 percent, a decrease of 2.7 percentage points from the May reading of 52.7 percent. The Production Index registered 54.1 percent, a 2.8-percentage point increase compared to the May reading of 51.3 percent. The Employment Index registered 54.5 percent, an increase of 0.8 percentage point from the May reading of 53.7 percent. The Supplier Deliveries Index registered 50.7 percent, a 1.3-percentage point decrease from the May reading of 52 percent. The Inventories Index registered 49.1 percent, a decrease of 1.8 percentage points from the May reading of 50.9 percent. The Prices Index registered 47.9 percent, a 5.3-percentage point decrease from the May reading of 53.2 percent."
With a U.S./China trade truce executed at the G-20 Summit and with Mexico/U.S. now more aligned on what needs to be done to minimize the issues taking place at the Southern Border, we would be of the opinion that manufacturing activity resumes higher in the month of July. Aside from the trade-related issues, what underpins my view that manufacturing will uptick in the coming months is that sales continue to grow above the rate of expected earnings, suggesting consumer demand remains ebullient. Hence, the soft data indicated by global PMIs has not been entirely congruent with the hard economic data.
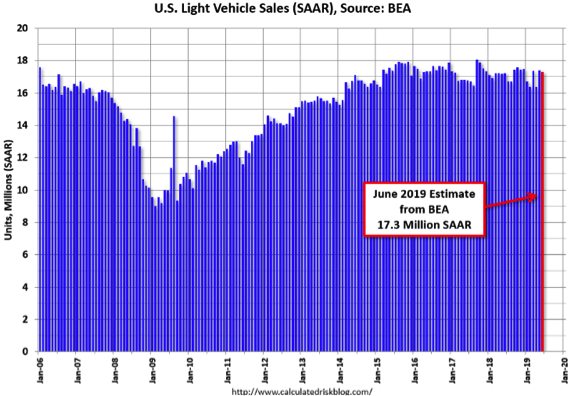
In other, under the radar economic data results for the month of June, The BEA released their estimate of June vehicle sales. The BEA estimated sales of 17.29 million SAAR in June 2019 (Seasonally Adjusted Annual Rate), down 0.6% from the May sales rate, and up slightly from June 2018.
Sales in 2019 are averaging 16.9 million (average of seasonally adjusted rate), down 1.4% compared to the same period in 2018.
For this week, I believe investors will be more heavily focused on the Fed’s testimony before congress.
Federal Reserve Chair Jerome Powell has the opportunity to reinforce market expectations for a late July rate cut or rein them in when he speaks to Congress this week. Powell testifies before the House Financial Services Committee Wednesday and at the Senate Banking Committee Thursday, and is expected to answer questions on the economy and Fed policy.
Nonetheless, the weekly economic data for the upcoming week is as offered in the table provided by MarketWatch:

Fund Flows
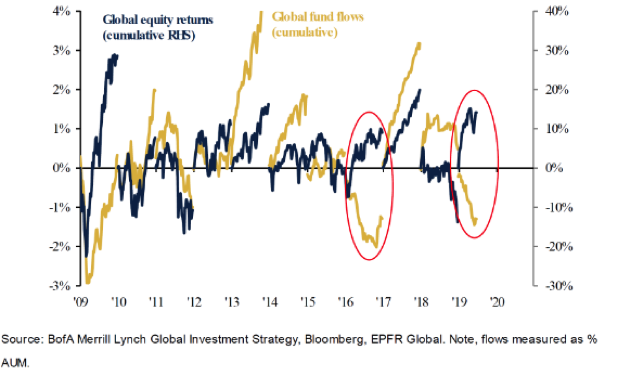
While you’d think flows and stocks would be moving in tandem, Bank of America shows flows and equity returns are the most disconnected since 2016.
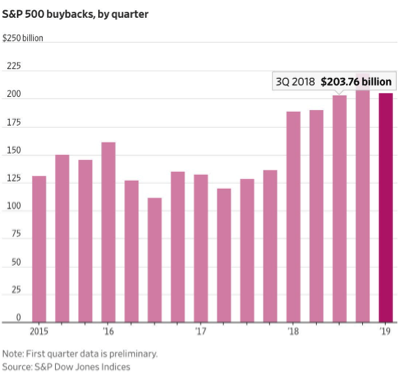
So how is the market rising to the extent it has in 2019? As mentioned previously, corporate purchases are filling the gaps where the average investor and fund manager are failing to participate. Share repurchases contracted for the 1st time in 7 quarters in the Q1 period. While still robust, it’s down from record in the 4th quarter of 2018.
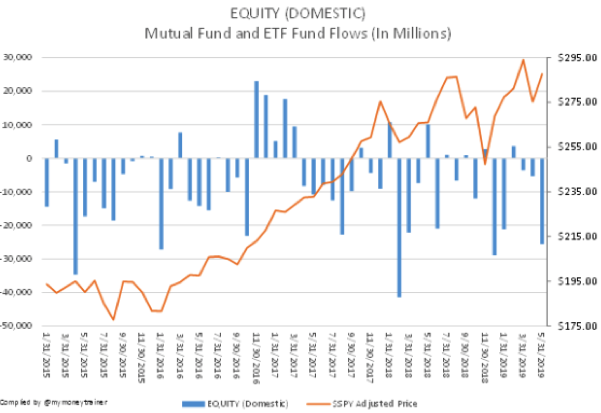
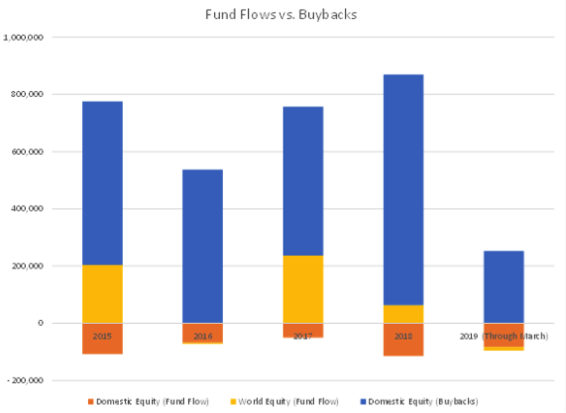
The appetite for U.S. equities hasn’t been faltering in 2019 alone but in the past few years. U.S. equities have had almost no demand at all. The level of outflows has far exceeded the inflows. In the last year, there has been almost only selling of U.S. equities.
Unless something moves investors off the sidelines and paints a clear path toward sustainable growth in what many people believe to be the late innings of the expansion cycle, it is unlikely that fund flows will shift into 2020. Having said that, I don’t foresee the share repurchase programs faltering much going forward given sales strength coupled with ever-declining real rates.
Q2 2019 Earnings Outlook
Earnings season isn’t expected to come into full swing until the week of July 15, with Citigroup (C) reporting before the opening bell. It’s at that time that the big money center banks will begin reporting their Q2 2019 results. Ahead of this period, Lipper/Refinitiv has lowered their respective Q2 2019 Earnings outlook as to express EPS growth of .2% to flat EPS growth in the quarter.
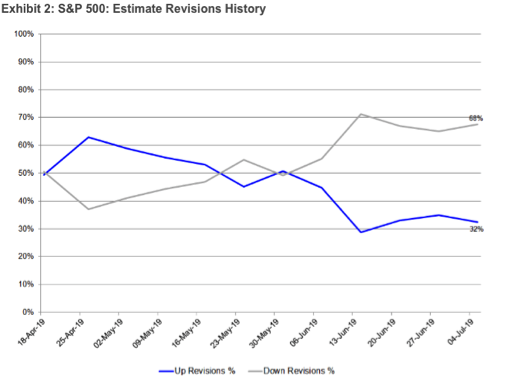
Aggregate Estimates and Revisions
- Second quarter earnings are expected to decrease 0.0% from 18Q2. Excluding the energy sector, the earnings growth estimate is 0.2%.
- Of the 21 companies in the S&P 500 that have reported earnings to date for 19Q2, 85.7% have reported earnings above analyst expectations. This compares to a long-term average of 65% and prior four-quarter average of 76%.
- 19Q2 revenue is expected to increase 3.4% from 18Q2. Excluding the energy sector, the growth estimate is 3.9%.
- 76.2% of companies have reported 19Q2 revenue above analyst expectations. This compares to a long-term average of 60% and an average over the past four quarters of 63%.
- For 19Q2, there have been 85 negative EPS preannouncements issued by S&P 500 corporations compared to 23 positive, which results in an N/P ratio of 3.7 for the S&P 500 Index.
- The forward four-quarter (19Q3 –20Q2) P/E ratio for the S&P 500 is 17.1.
- During the week of July. 8, three S&P 500 companies are expected to report quarterly earnings.
Investors and analysts remain concerned that the Q2 earnings season will express an earnings decline, as slowing corporate profits have been realized from the Q3 2018 period through the Q1 2019 period. Ned Davis discusses the QoQ and YoY earnings growth slowdown in his recent notes to clients.
“Actual corporate profits for all corporations peaked in the third-quarter of 2018, according to the GDP report, at $2.321 trillion,” Davis wrote in a Friday note to clients. “They fell to $2.311 trillion in the fourth quarter and fell to 2.252 trillion in the first quarter of 2019.”
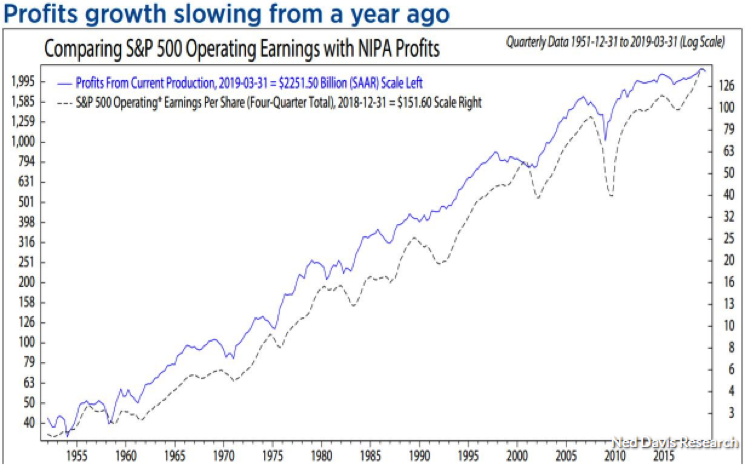
Operating earnings per share for the S&P 500 index have continued to climb higher as a result “of a lot of creative accounting, including massive buybacks,” Davis added.
Davis foresees corporate profits falling further, based on low CEO confidence, according to the Conference Board’s measure of CEO confidence and falling commodity prices, as measured by the CRB raw industrial spot index.
Falling corporate profits are not a good sign for the economy overall, as economic recessions are almost always accompanied by falling corporate profits, corroborating the concern shown of late by bond markets. Having said that, the rate of change from 20% earnings growth in 2018 to flat-3% EPS growth in 2018 is more a factor of the Tax Reform stimulus providing a boost to profits last year that has since wound down. With that being recognized, if we strip out 2018 EPS and make the leap from 2017 to present, we see that 2019 EPS is still well above EPS in 2017.
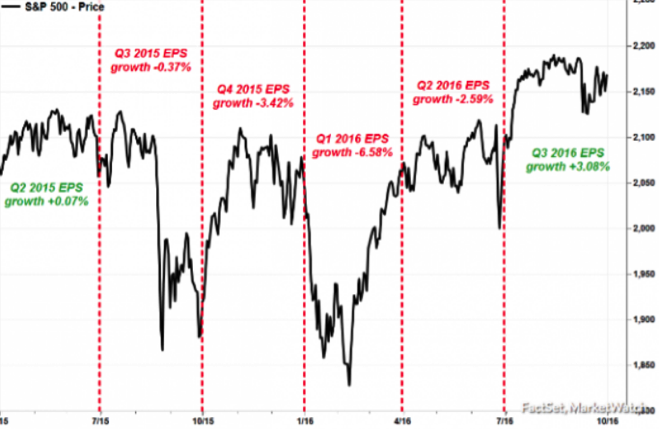
Another consideration is that the markets are always forward-looking and an earnings recession does not always correlate with an economic recession or falling equity indices as witnessed with the 2016 earnings recession. Recall that earnings declined from Q3 2015 through Q2 2016. After the market drawdown in 2015, it quickly recovered to represent the H2 2016 forecast recovery in earnings. Sound familiar? Recall the S&P 500 fell some 20% in Q4 2018 only to rebound here in 2019 as we see analysts forecasting an earnings recession. (FundStrat Chart)
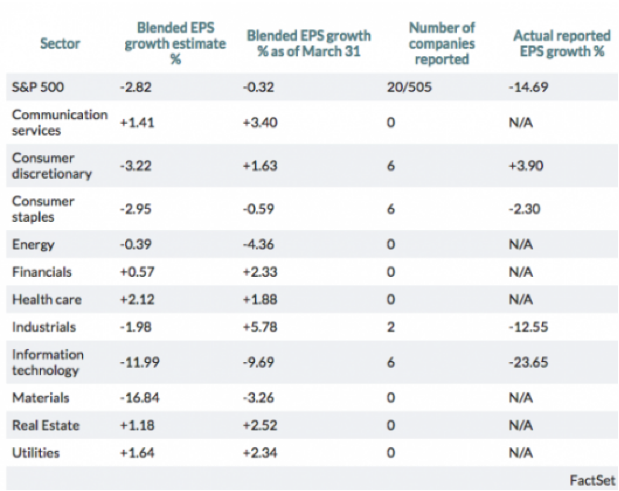
FactSet has recently updated its Q2 2019 EPS projections to reflect a deeper earnings decline than the previous weekly forecast. Last week the firm projected EPS to decline -2.6%, which it now sees declining -2.82% for the Q2 2019 period.
Investor Takeaways
I'm of the opinion that fiscal stimulus from the Tax Reform and Jobs Act of 2017, along with decreased regulation and increased government spending, will continue to support the U.S. economy in 2019. I can validate our belief in the greatest demand-side statistic there is within a consumer-based economy, sales!
Uncertainty around global trade continues to dampen the benefits of fiscal support and may be discouraging productivity-enhancing capital investment. Current equity valuations are only slightly above historical levels, interest rates remain low, inflation has been contained, and currency volatility appears to be abating, allowing for second-half conditions to support markets. Challenges do lie ahead, however. Global trade is still contracting, the second-half calendar is full of possible geopolitical stumbling blocks, consumer spending has downshifted, and business capital spending remains below expectations.
While fiscal policy has taken the lead, monetary policy grew more supportive in the first half of 2019. The Federal Reserve indicated earlier this year that it would likely hold on raising interest rates for the rest of 2019, partly in response to the market’s dire reaction to last December’s rate increase and poor messaging on future rates and the Fed’s balance sheet. With inflation low, global growth slowing, and trade risk still present, monetary policy may be too tight for the current environment.
I remain with the viewpoint and outlook that finds domestic GDP running between 1.8 and 2.3% for the remainder of 2019. In order to achieve this outlook, a Fed insurance cut is considered optimal given the geopolitical uncertainty that has taken its toll on business confidence.
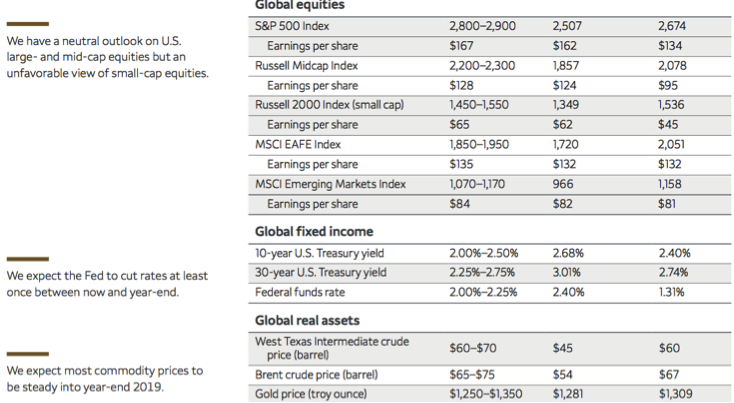
Equity markets have run fast and furiously through June and have achieved an all-time high on the S&P 500 index. With the reality that the longer and harder equities run, the likelihood of a drawdown increases; I anticipate a near-term market correction of roughly 3-7%, with a greater drawdown should the FOMC fail to meet the market’s expectations come July 31. Presently and with respect to year-to-date S&P 500 returns, investors are afforded a few opportunities to act, according to Wells Fargo Investment Institute: (Wells Fargo price targets and outlook below)
1) Rebalance when volatility strikes.
In most asset classes, we suggest taking steps to maintain the strategic or long-term target allocation designed to achieve an investor’s long-term goals. As markets rise, the positions may need to be trimmed and the cash held or reallocated to markets where valuations are better. As markets fall, the opportunity may arise to restore the target allocation.
2) Reduce price volatility with income-generating assets.
Income is a sometimes overlooked component of portfolio returns, as shown in the graph on the next page. Based on a Wells Fargo Investment Institute Moderate Growth and Income portfolio model, nearly one-third of the total return would have come from income during this economic expansion since 2009. To potentially improve the income-generating ability of a portfolio, you can lengthen the duration of your high-quality bonds (using a neutral overall duration and yield-curve profile). Dividend-paying stocks and REITs offer additional streams of portfolio income. We view the current difference between the yields of lower-quality and higher-quality bonds as not worth the increase in default and market risk.
3) Use cash to your advantage.
We expect equity markets to remain volatile. On rallies that take benchmark indices (for example, the S&P 500 Index) above our target levels, we suggest realizing some of the gains and placing the proceeds in cash—to await a better entry point in the coming months. If a portfolio already holds a sizable amount of cash, there is no need to raise more; instead, investors should be prepared to invest cash should markets correct in the coming months. Another potential strategy is dollar cost averaging, which involves investing cash over time to take advantage of market fluctuations.*
4) Consider greater exposure to emerging market equities and sectors that represent higher-quality earnings.
Investing in international assets is an important way to diversify a portfolio. In recent years, U.S. equity markets have led global markets, but that trend may be changing. Currently, we are favorable on emerging market equities. Valuations in many emerging markets look attractive, and recent economic data point to stable economies in China and other developing countries. Within U.S. equity markets, we favor sectors such as Information Technology and Industrials, areas of the market with higher-quality earnings.
5) Add strategies that can benefit from various market conditions.
A bear market can occur with little warning; so adding assets that can profit in both up and down markets may help prepare a portfolio for possible downturns. The hedge fund strategies we currently favor are equity hedge, relative value, and event-driven. Private equity and private debt may also attract long-term investors. These asset classes can provide access to innovative, fast-growing companies and to high-yielding debt. Now may be a good time for qualified investors to begin building an allocation to private debt, ahead of an eventual economic downturn that could provide opportunities for distressed debt managers. Also for qualified investors, additional potential opportunities are available utilizing options.
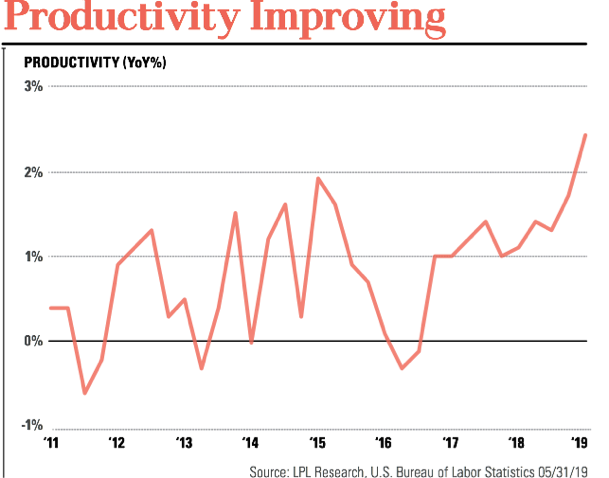
A key factor to sustaining and elongating the current business cycle is continuously overlooked. Productivity growth is the key to sustaining this virtuous cycle. We saw a glimpse of this in the first quarter, as productivity grew at the strongest pace since 2010
Lastly, I leave you with the latest dissemination from Morgan Stanley’s chief market strategist, Mike Wilson. He remains of the belief that the market will correct by 10% over the next month or so, as earnings and guidance prove underwhelming and dashing hopes of an H2 earnings growth recovery. Concerns remain elevated as it pertains to earnings guidance for the Q3-Q4 periods.

As the market has run feverishly in 2019, a pullback of 10% may not occur based solely on earnings results and guidance, but for any multitude of reasons. With that being put forth, we look forward to the second half of FY19 and the opportunity it yields investors.


Good advice.