
This morning the Institute for Supply Management published its monthly Manufacturing Report for September. The latest headline Purchasing Managers Index (PMI) was 50.9, down 1.9 from the previous month and in expansion territory. Today's headline number was below the Investing.com forecast of 52.2.
Here is an excerpt from the report:
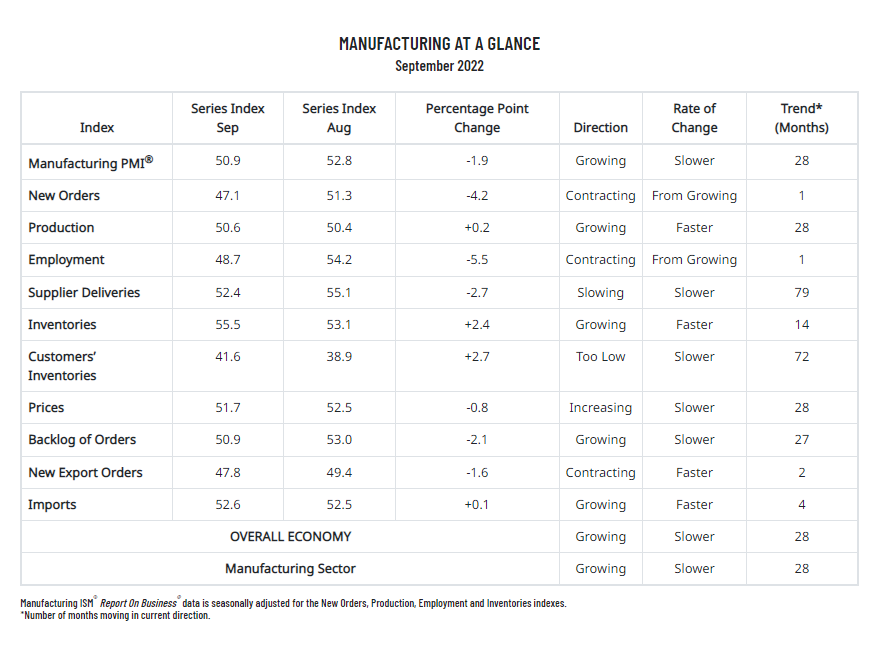
Fiore continues, “The U.S. manufacturing sector continues to expand, but at the lowest rate since the pandemic recovery began. Following four straight months of panelists’ companies reporting softening new orders rates, the September index reading reflects companies adjusting to potential future lower demand. Demand eased, with the (1) New Orders Index returning to contraction, (2) New Export Orders Index in contraction for a second consecutive month, (3) Customers’ Inventories Index remaining at a low level but as close as it’s been to an ‘about right’ reading since early in the pandemic and (4) Backlog of Orders Index approaching contraction. Consumption (measured by the Production and Employment indexes) declined during the period, with a combined negative 5.3-percentage point impact on the Manufacturing PMI® calculation. The Employment Index returned to contraction after one month of expansion, and the Production Index increased by 0.2 percentage point, staying in growth territory, but at a modest level. Many Business Survey Committee panelists’ companies are now managing head counts through hiring freezes and attrition to lower levels, with medium- and long-term demand more uncertain. Inputs — defined as supplier deliveries, inventories, prices and imports — accommodated growth. The Supplier Deliveries Index reached an appropriate tension level, and the Inventories Index increased as panelists’ companies continued to manage the total supply chain inventory. The Prices Index decreased for a sixth straight month and is not far from contraction territory, and the Imports Index modestly grew. See report
Here is the table of PMI components.
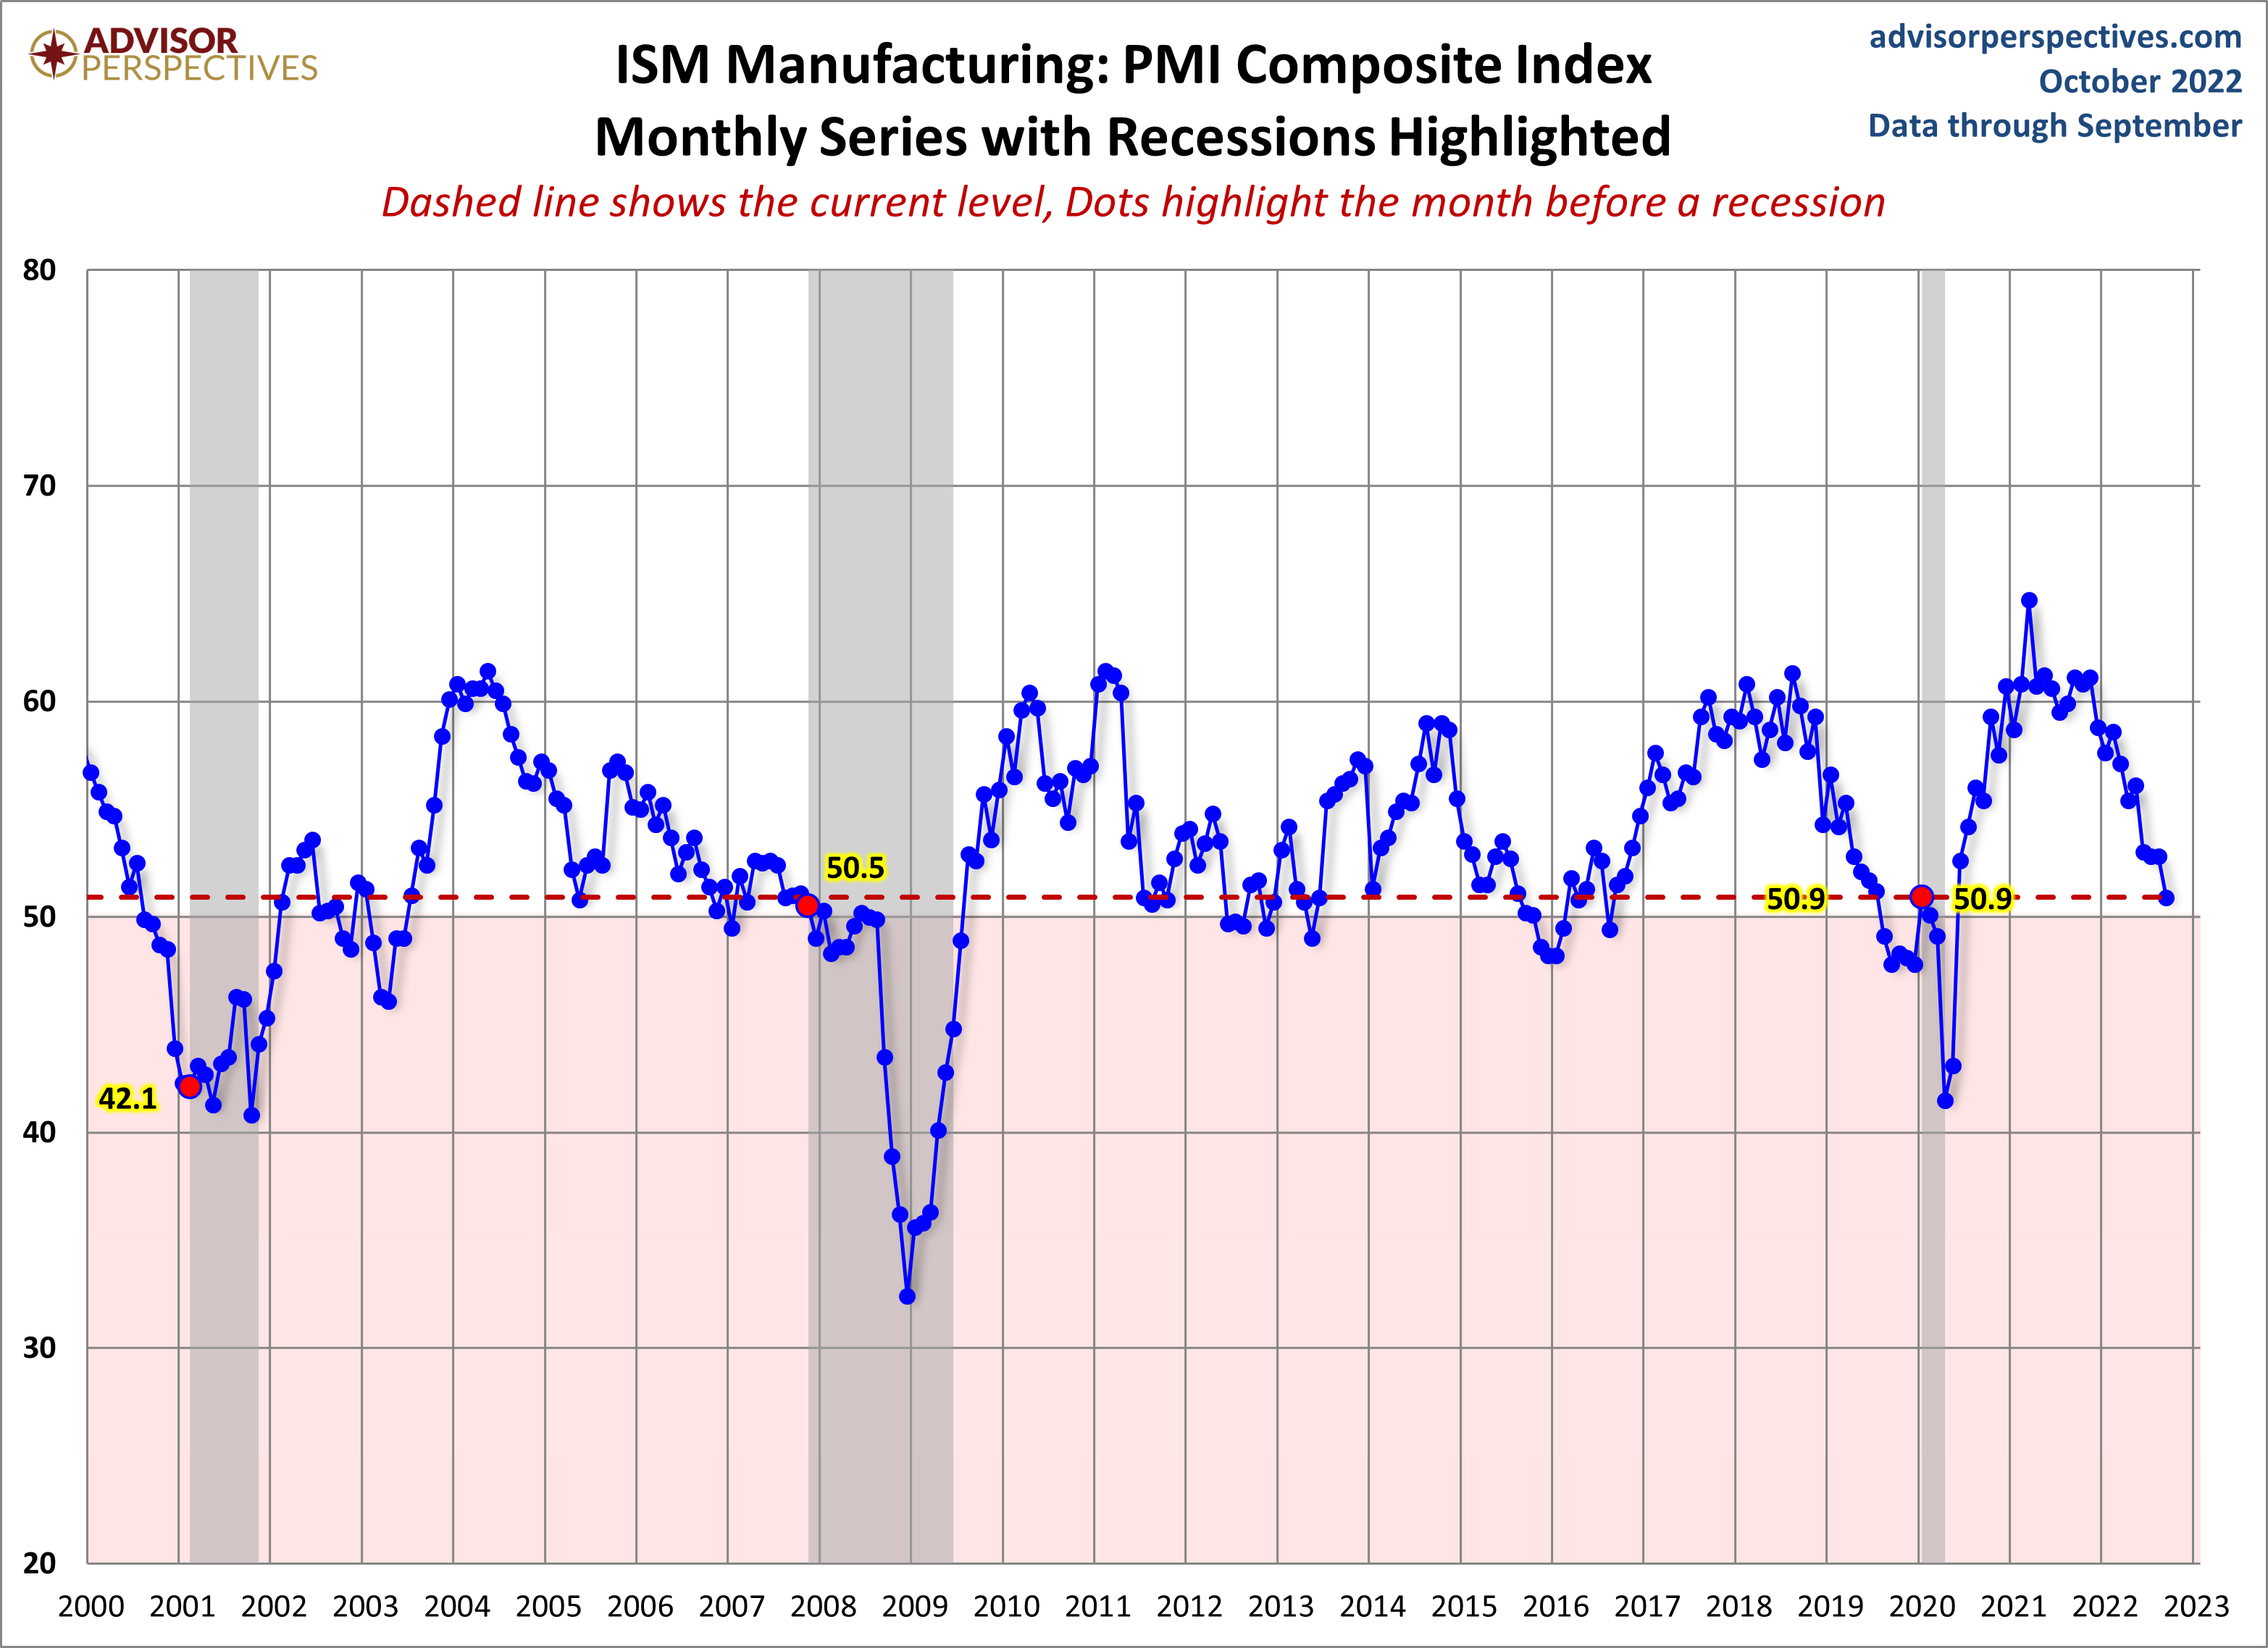
The chart below shows the Manufacturing Composite series, which stretches back to 1948. The eleven recessions during this time frame are indicated along with the index value the month before the recession starts.

For a diffusion index, the latest reading is 50.9 and indicates expansion. What sort of correlation does that have with the months before the start of recessions? Check out the red dots in the chart above.
Here is a closer look at the series beginning at the turn of the century.
More By This Author:
Real Disposable Income Per Capita Creeps Up In August
Moving Averages: S&P Down 9.3% In September
The Big Four: Real Personal Income In August


Comments
Log in or sign up to join the conversation.