
Is There Any Upside From Here? - Monday,July 22
Let's review. The S&P 500 is just 5 days removed from its most recent all-time high. Central bankers around the globe are either cutting rates or getting ready to cut rates. Economic growth is slowing. Earnings in the U.S. continue to beat estimates (although the bar for the current season appears to be sitting on the ground). Inflation is nowhere to be found. And the trade war between the U.S. and China looks like it is destined to drag on (at least until election season heats up next year).
Cutting to the chase, our furry friends in the bear camp argue that the trade war will drag the global economy into recession - and the U.S. along with it. And we all know what happens to stock prices when the "R Word" starts being bandied about.
Our heroes in horns pulling the bull bandwagon tell us to never, ever "fight the Fed" and that everything will be fine.
Given that the stock market tends to be a discounting mechanism for future expectations, it looks to me like "Ms. Market" is leaning bullish these days. In short, stocks appear to be looking ahead to better days. Days when the trade war is over, interest rates are lower, and the economies of the world are improving.
Personally, I can get on board with the bulls' argument here. Since central bankers in general and the U.S. Fed specifically tend to "get what they want" when they are on a mission, it makes sense to embrace the "Don't fight the Fed" mantra and stay seated on the bull train.
The Question Is...
But (you knew that was coming, right?)... The question of the day is, can stocks go any higher from here without any of the bull camp's hopes/dreams coming true? In other words, can stocks move up in a meaningful way without any proof that things are actually getting better?
This is where the concept of the appropriate market multiple comes in. You see, there are times when investors are gaga for stocks and are willing to pay just about anything due to future expectations (think 1998/99). Then there are other times when folks are completely uncertain about the road ahead and demand lower prices for their investment in a dollar's worth of earnings (early 2009 comes to mind here).
Let's Look at Valuations
In order to try and determine if stocks are cheap or expensive and, in turn, whether the indices have any upside from here, let's take a look at the valuation picture. In this case, I'm going to focus on the Price-to-Earnings ratio of the S&P 500 using operating earnings.
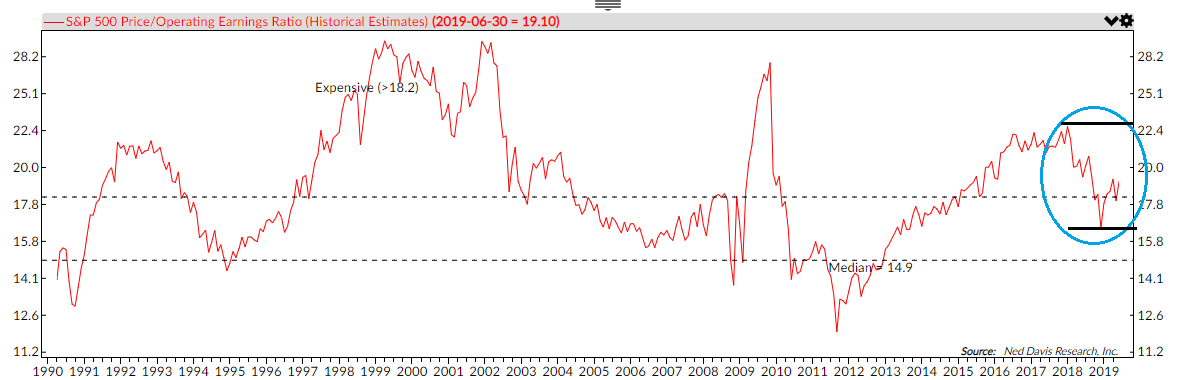
The chart below, from the folks at Ned Davis Research, is the S&P 500's P/E Ratio based on operating earnings plotted monthly back to 1990.
(Click on image to enlarge)
Source: Ned Davis Research
Okay, let's get to the numbers. Currently (as of 6/30), the S&P's Operating Earnings P/E stands at 19.1. According to NDR, this is in the "expensive" zone and well above the historical median of 14.9. However, it is important to recognize that NDR's assessment of the "expensive" zone, as well as the median P/E, goes back to 1926.
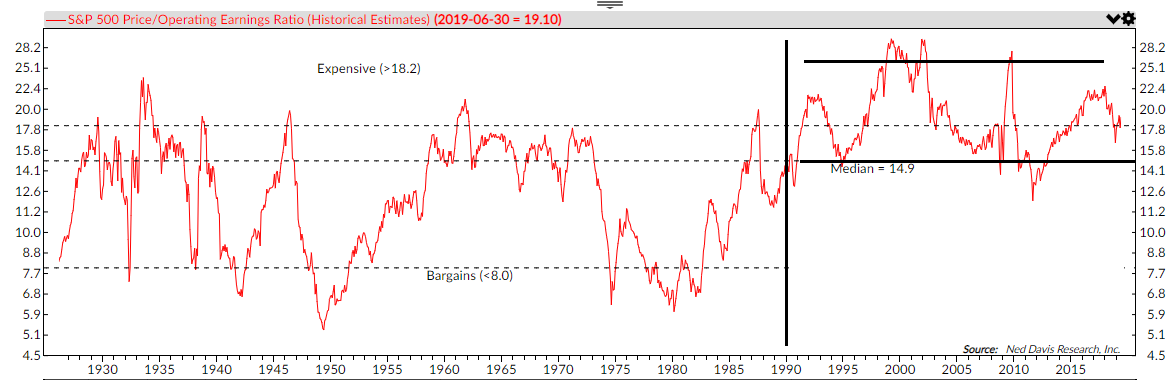
I choose to start in 1990 as I believe this is when the market's valuation range began to shift. I contend that this shift occurred due to 401K's replacing defined-benefit pensions and the resulting ongoing demand for stocks. The chart below illustrates my view on the subject nicely...
(Click on image to enlarge)
Source: Ned Davis Research
So, in what I'll call the "current era" of the market's P/E ratio (since 1990), a reading of 19.1 looks to be, well, middle of the road.
Next, let's focus on the most recent range. The high-water mark seen on 1/31/2018 was 22.4 and the low level of 16.5 occurred on 12/31/2018. Again, I'll contend that the current reading is in the middle.
The point is that from a near-term perspective, my take is stocks are neither cheap nor expensive. And given the uncertainties facing investors these days in term of the trade war and economic growth, this seems about right.
Let's Look Ahead
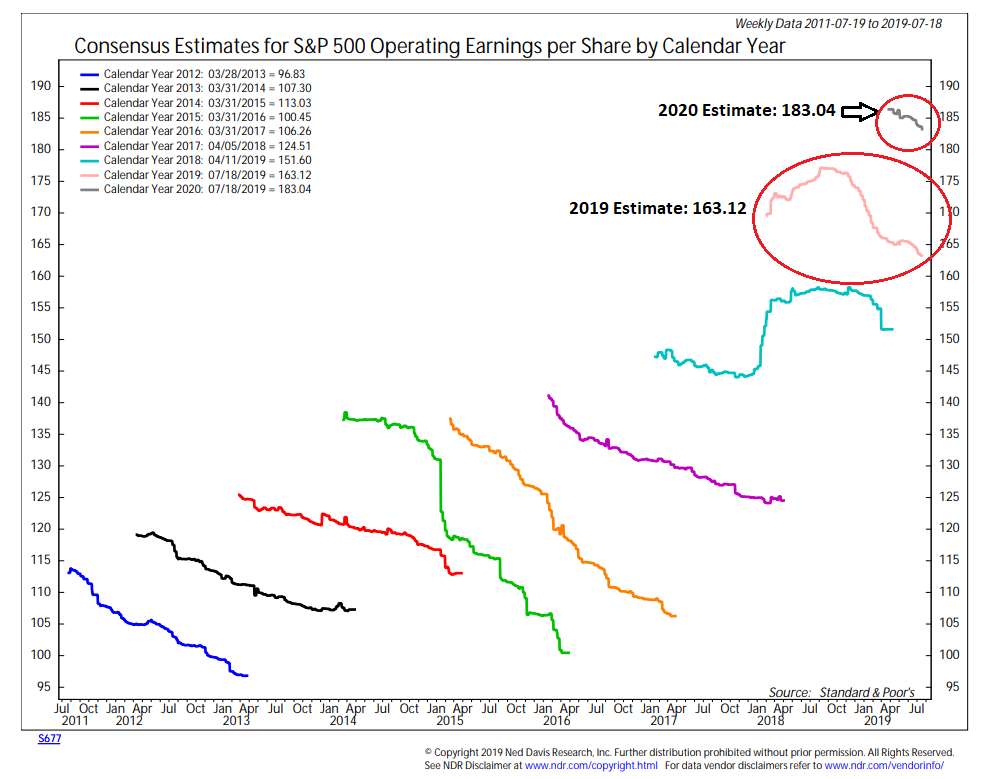
Since we're now officially in the back half of 2019, it's time to look ahead to where analysts expect earnings to be next year. Currently, the consensus estimate for earnings per share (EPS) on the S&P 500 for 2019 stands at $163.12 (Source: Standard & Poor's). It is important to note that this number has continued to drift lower throughout the year due to the impact of trade and #GrowthSlowing.
For 2020, the consensus estimate for S&P EPS stands at $183.04. Granted, it's very early in the game, but it's what we have to work with at the present time.
(Click on image to enlarge)
Source: Ned Davis Research
First, we need to recognize that as the chart above illustrates, EPS estimates tend to start out too high and are adjusted lower over time. Thus, we should probably expect EPS for next year to trend lower.
But using current numbers, if we apply a 19.1 multiple to EPS of $183.04, we get 3507, which would put the S&:P 500 17.8% higher than Friday's close.
Next, let's apply the most recent range of P/E's to the EPS estimate for 2020. At the low end is 16.5, which gives us 3030 - or just 1.8% above Friday's close.
And on the high end, $183.04 times 22 equals 4040, or 35.7% higher from current readings.
Yea, But...
I know what you're thinking. And I agree, 2020's actual EPS is likely to be below where current estimates reside. With the exception of 2018 (where analysts had to adjust EPS up throughout the year due to the tax cuts), this is usually the case.
So, if we knock the consensus of $183.04 down by 10%, we get $165.27. At 19.1 times earnings, we get 3157, which is 6.1% higher than Friday's close. And if we get to "giddy" times again in the market (where investors are willing to pony up due to improving expectations), a 22 multiple puts the S&P at 3636 - or 30% higher than here.
The Takeaway
The takeaway from this back-of-the-napkin approach is that if the economy doesn't slow meaningfully, then yes, there could be upside in the stock market from here. Perhaps substantial upside.
However, if the gaggle of central bankers can't keep the economies of the world from entering a recession, there could be problems. But, of course, we knew that already. Such is the game of multiple expansion/contraction.
Weekly Market Model Review
Now let's turn to the weekly review of my favorite indicators and market models...
The State of My Favorite Big-Picture Market Models
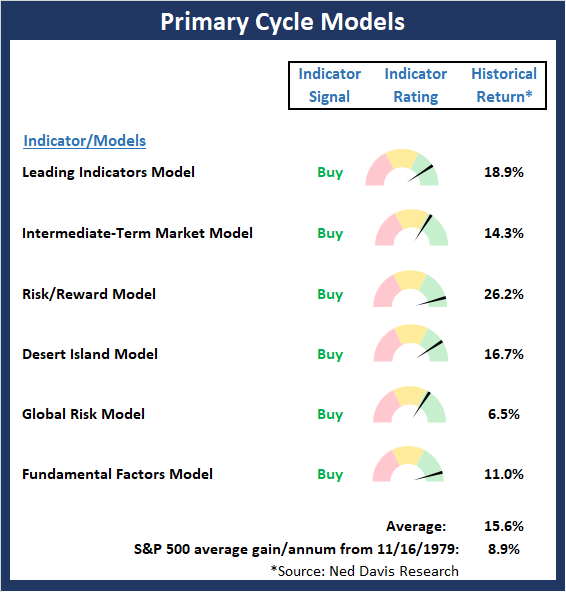
Once again, there are no changes to the Primary Cycle board this week. The models designed to indicate the state of the big-picture market cycle are in pretty good shape. And since the inevitable pullback/sloppy period we had been anticipating appears to upon us, the Primary Cycle board tells us to think about the current weakness as an opportunity to add exposure.
This week's mean percentage score of my 6 favorite models slipped to 79% from 83.9% last week (Prior readings: 81.1%, 73.5%, 62.9%, 65.4%, 62.9%, 60%) while the median also pulled back to to 80.0% versus 86.7% last week (Prior readings: 82.5%, 68.5%, 66.3%, 71.3%, 68.8%, 62.5%, 62.5%).
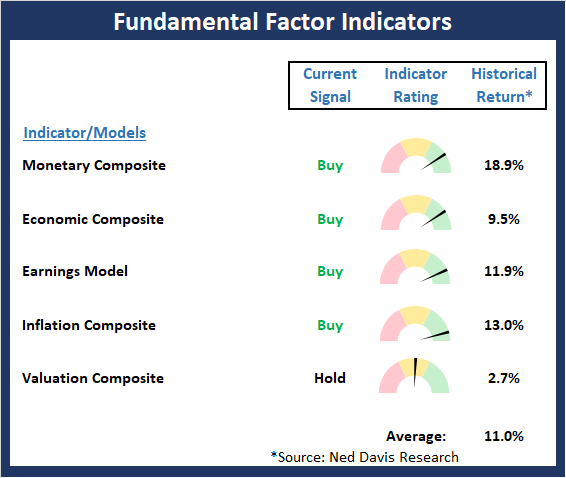
The State of the Fundamental Backdrop
The has been no movement in our Fundamental indicators and the board remains positive overall.
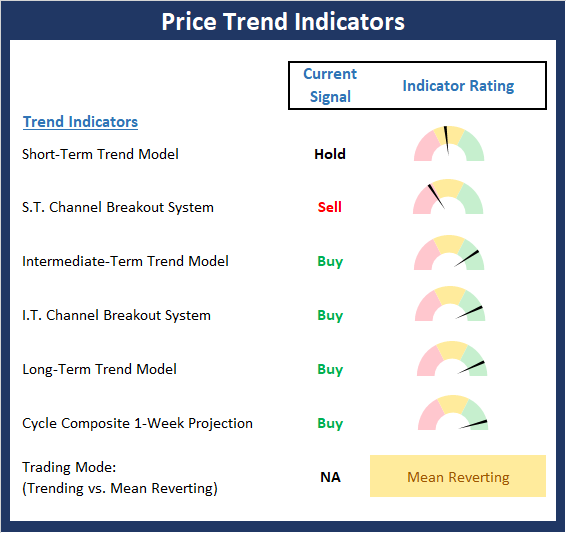
The State of the Trend
The shorter-term trend indicators took a hit last week as an overdue pullback took hold. A test of the 2950 level would appear to be a logical retrace of the current summer rally. However, it is important to recognize that the longer-term indicators remain positive on balance. Finally, it is worth noting that the cycle projection suggests a pause is to be expected in the coming weeks.
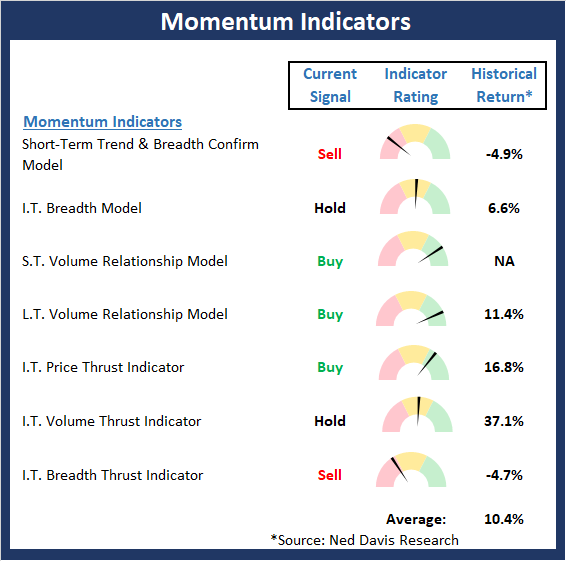
The State of Internal Momentum
So far at least, the current pullback is following the script as we had been looking for a short/shallow corrective phase to begin. Watching the Momentum board will be important going forward. While there has been some weakening, the overall "state" of the board remains constructive. As such, the bulls should be given the benefit of any doubt.
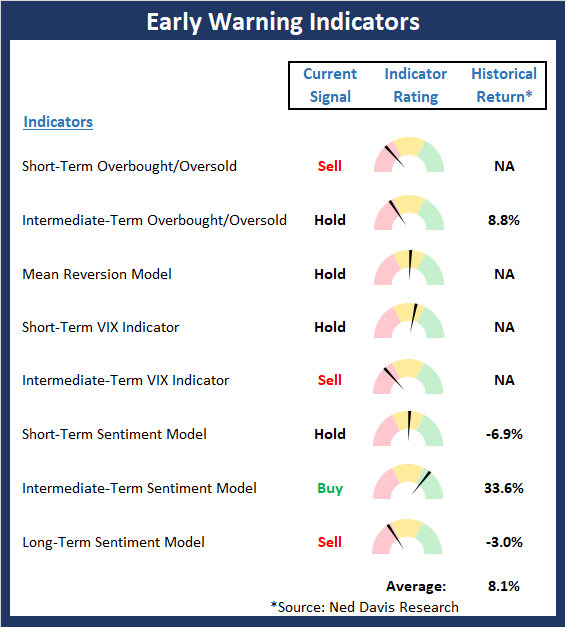
The State of the "Trade"
We had written recently that the table looked to be set for some corrective action but that it was not (yet?) a "table pounding" situation. Now that the pullback has begun, some of the Early Warning indicators (which can be thought of as pendulums) are already starting to swing the other way. The bottom line is the EW board leans bearish, but not meaningfully so.
Disclosure: At the time of publication, Mr. Moenning held long positions in the following securities mentioned: none - Note that positions may change at any time.
The opinions and forecasts ...
more

