
Is The Bull Really Dead?
It was just a month ago that we asked if there was any upside left in the S&P 500. Back then, we noted a “wall of worry” set up in the SPY-OEF spread, the price differential between the SPDR S&P 500 ETF (NYSE Arca: SPY) and the iShares S&P 100 ETF (NYSE Arca: OEF). The spread reflects stock investors’ enthusiasm; it climbs as confidence grows and drops when conviction wanes.
Just before the article’s publication, SPY-OEF hit an all-time high, but as that spread ratcheted higher, we fretted about a divergence in another indicator that signaled wobbling in the large-cap sector.
And now we find ourselves here. The SPY-OEF spread slipped off the worry wall, breaking its uptrend line on March 12 and leaving us to wonder just how bad the injury might be.
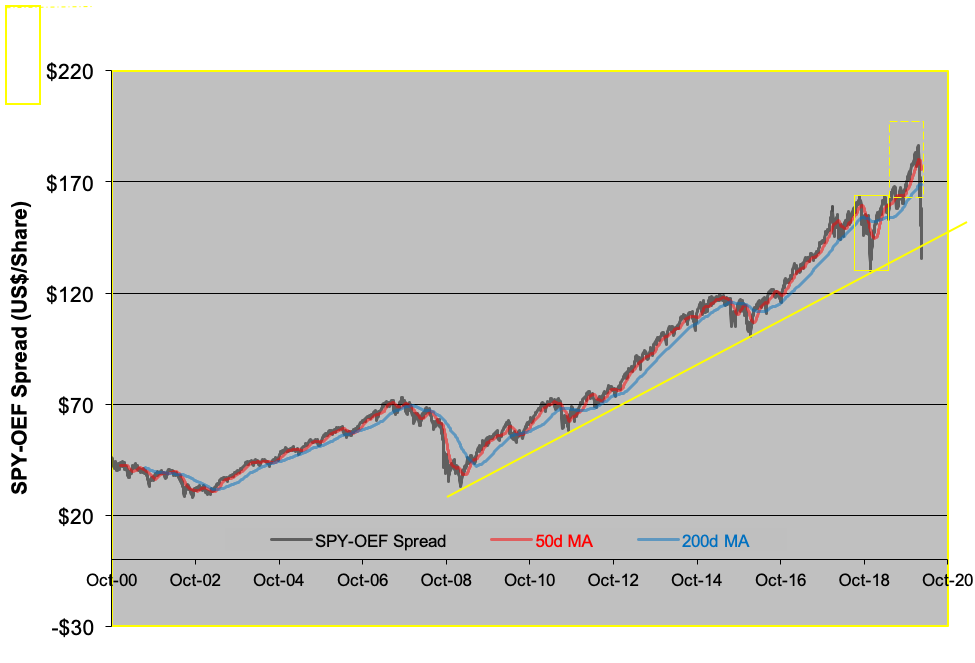
Well, wonder no more. Technically, the spread’s got the potential to retrace all the way back to $70, a level not visited since 2012. Historically, that translates to a 1,300 reading for the S&P 500. Oh, there are more than a few intermediate steps to stumble over to get down there—IF it gets down there—but that’s a discussion for a later date.
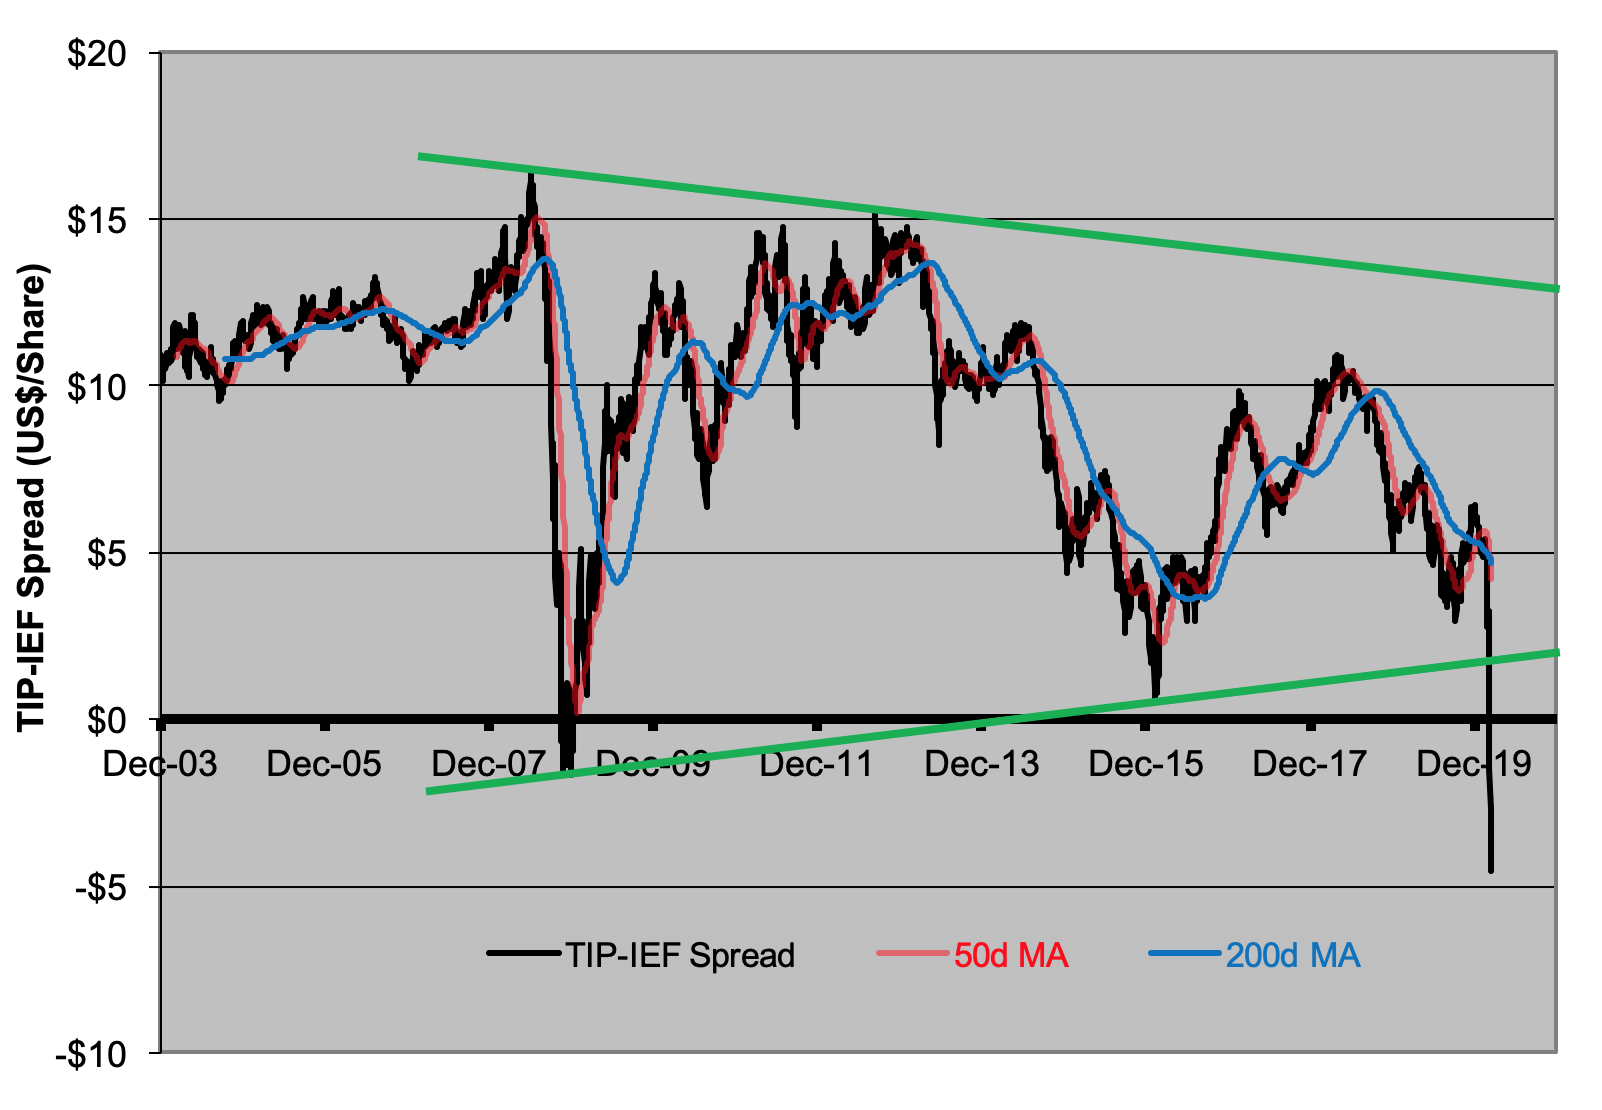
If that wasn’t enough to worry about, there’s another spread that just made a breakout move. Go back to August to recall the warning signs of a flip in the Treasury market. Back then, we were looking at the formation of a symmetrical triangle in the TIP-IEF chart. If you subtract the market price of the iShares 7-10 Year Treasury Bond ETF (NYSE Arca: IEF) from that of the iShares TIPS Bond ETF (NYSE Arca: TIP) you get a mirror-reversed characterization of the TIPS spread—a yield premium commonly commanded by conventional Treasury notes over inflation-protected notes of similar maturity.
Last week’s market rout set the stage for a downside break from the pattern, making IEF atypically more expensive than TIP. IEF is now threatening to become even pricier—by a margin of $19 or so. If you’re looking at the chart below, that means the spread could trade at quadruple its present discount. Barring exogenous events, IEF’s on a course to ascend to the $146-$147 level from its present $118 cost.
The White House declaration of a national emergency on Friday sparked a relief rally, nudging the SPY-OEF spread up $10 and squeezing the TIP-IEF discount by more than a $1. Despite these sanguine results, another key indicator—the XLY/XLP ratio—continued to deteriorate. We’ve often looked to the quotient of the Consumer Discretionary Select Sector SPDR ETF (NYSE Arca: XLY) over the Consumer Staples Select Sector SPDR ETF (NYSE Arca: XLP) to gauge consumer confidence. On Friday, the ratio slipped another 4 basis points towards a test of the ratio’s decade-long uptrend line.
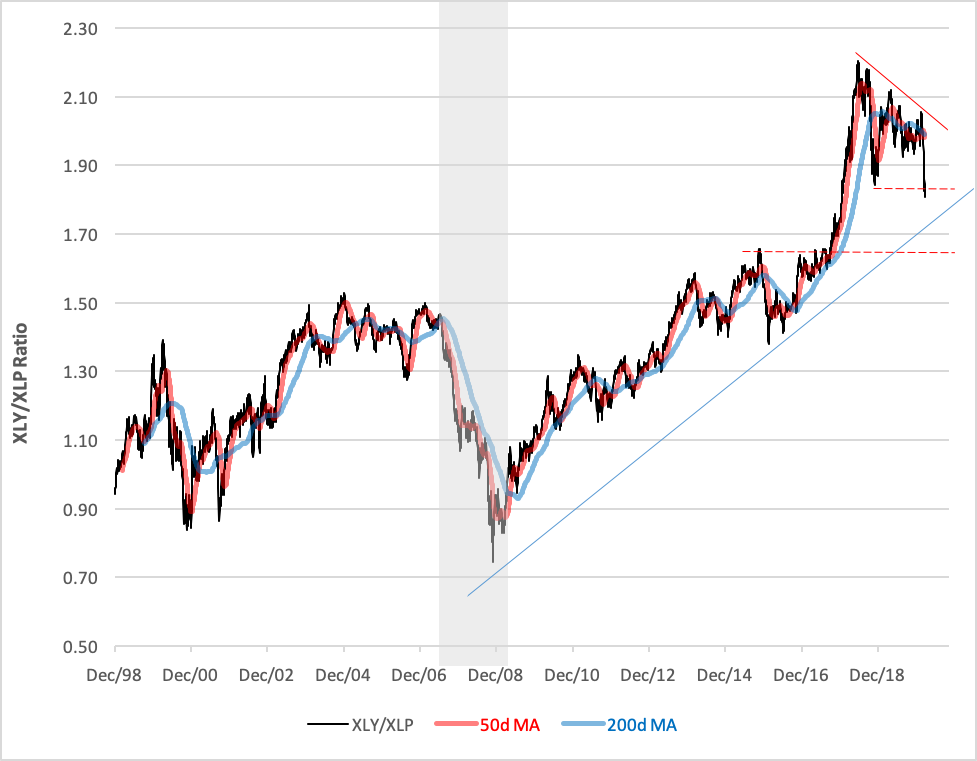
Given the domestic economy’s dependence on consumer spending, the course taken by this indicator is a critical tell-tale of the business cycle and warrants continuous monitoring.
Disclosure: None.


