
Is That It?
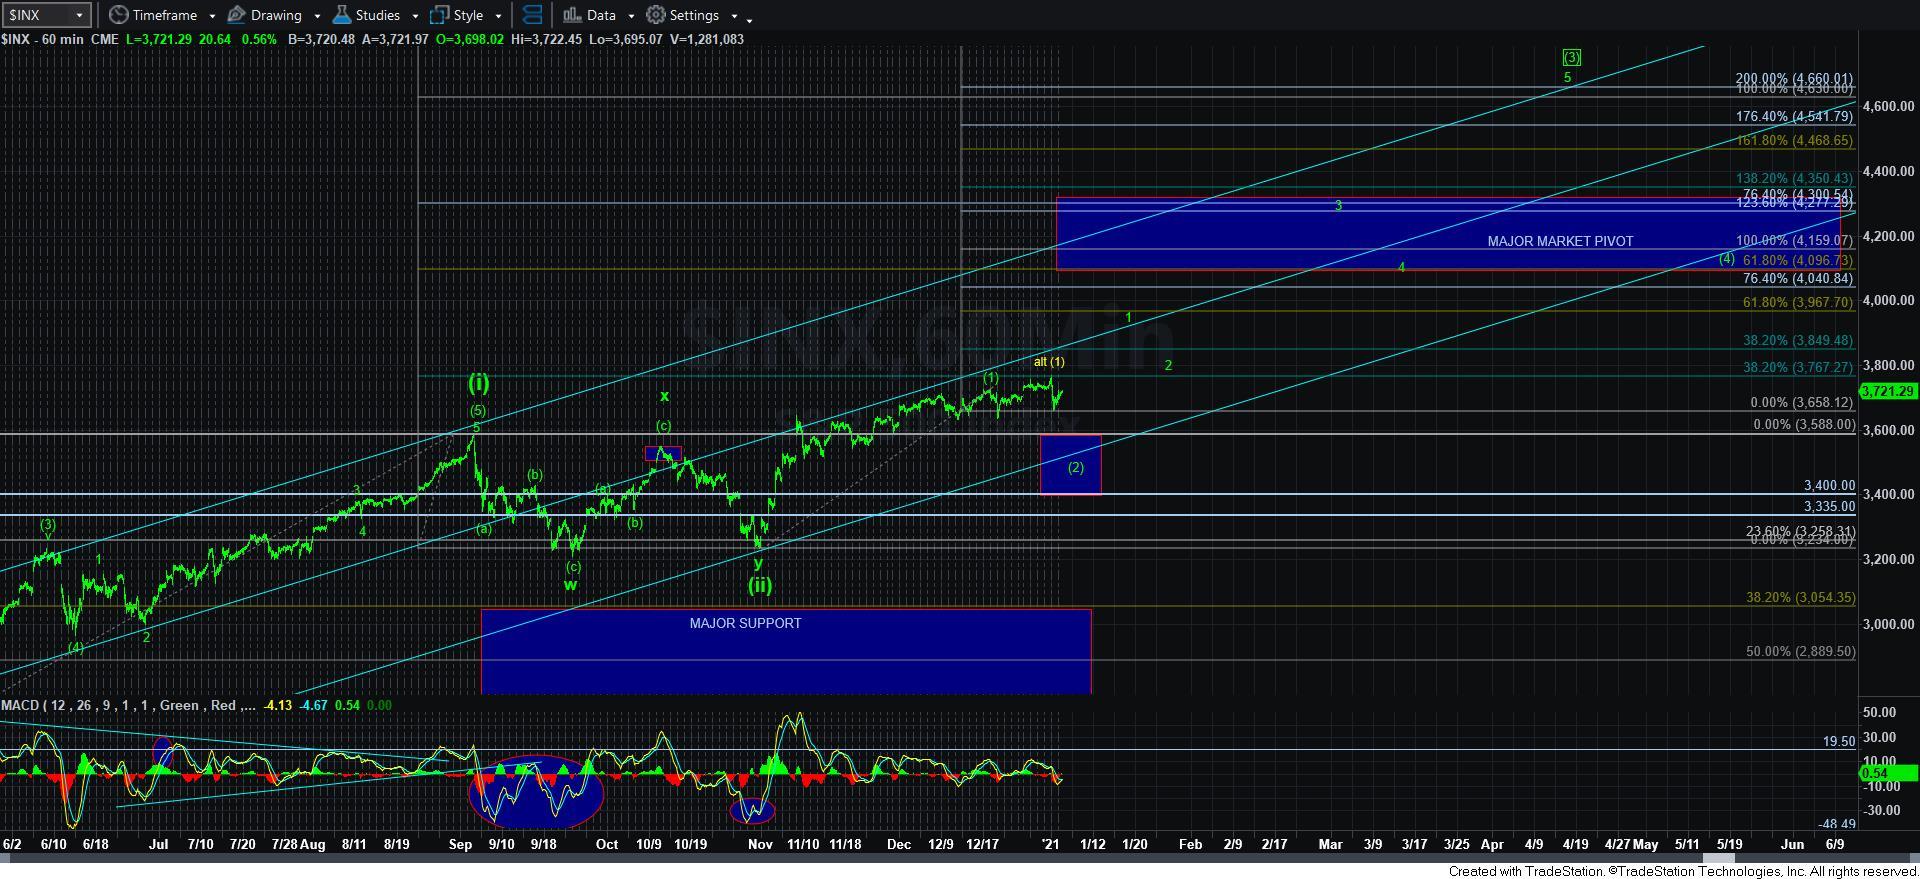
For well over a month, we have been looking for the market to tip its hand and provide us a more appropriate 2nd wave pullback. To date, the market has not really provided us with the appropriate base from which we can really rally to our next major target for wave [3] of [iii] in the 4600SPX region (the 1.00 extension of waves [i] and [ii]). And, it seems our patience has somewhat paid off.
But, is this all we are going to get from this wave [2] pullback?
Now, to be honest, based upon the manner in which I am counting this in green, it would suggest that we are two weeks into this wave [2]. While we are still quite shallow (as have been all the pullbacks off the March low), I can at least say that it is a much better base at this time than we would have had to rely upon several weeks ago.
But, in order for me to more confidently view us as having begun wave [3] to 4600SPX, I still need a clearer 5-wave structure off yesterday’s low. At this point in time, I cannot say I have that.
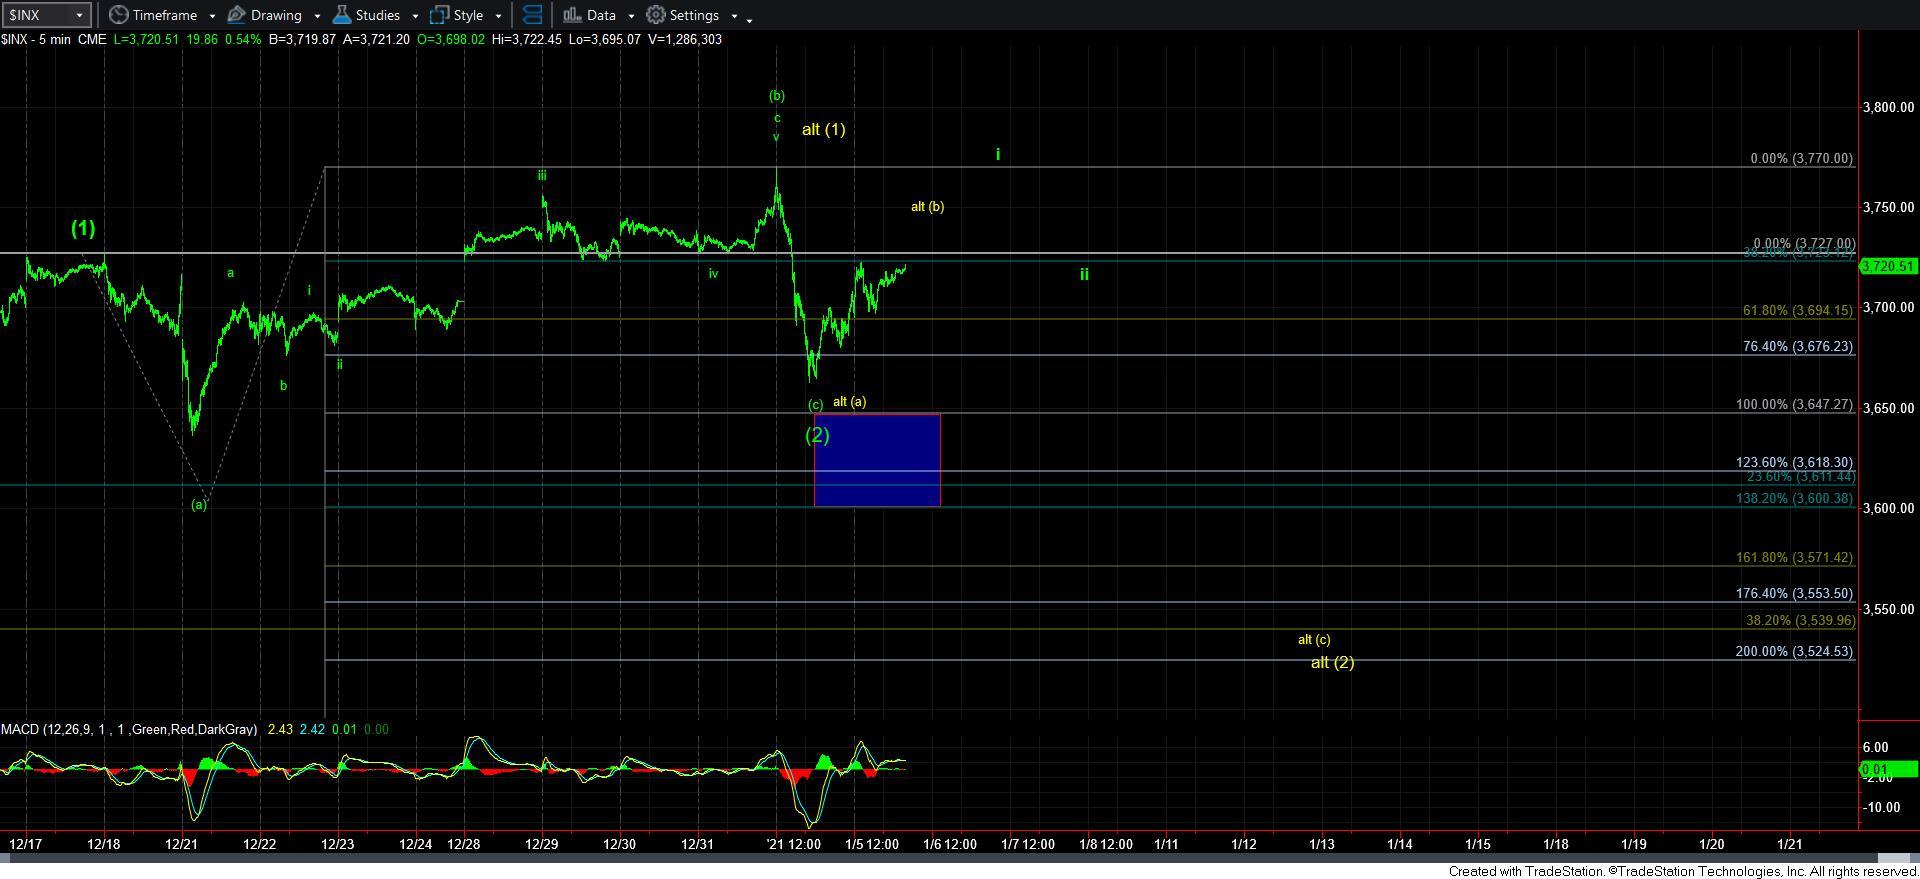
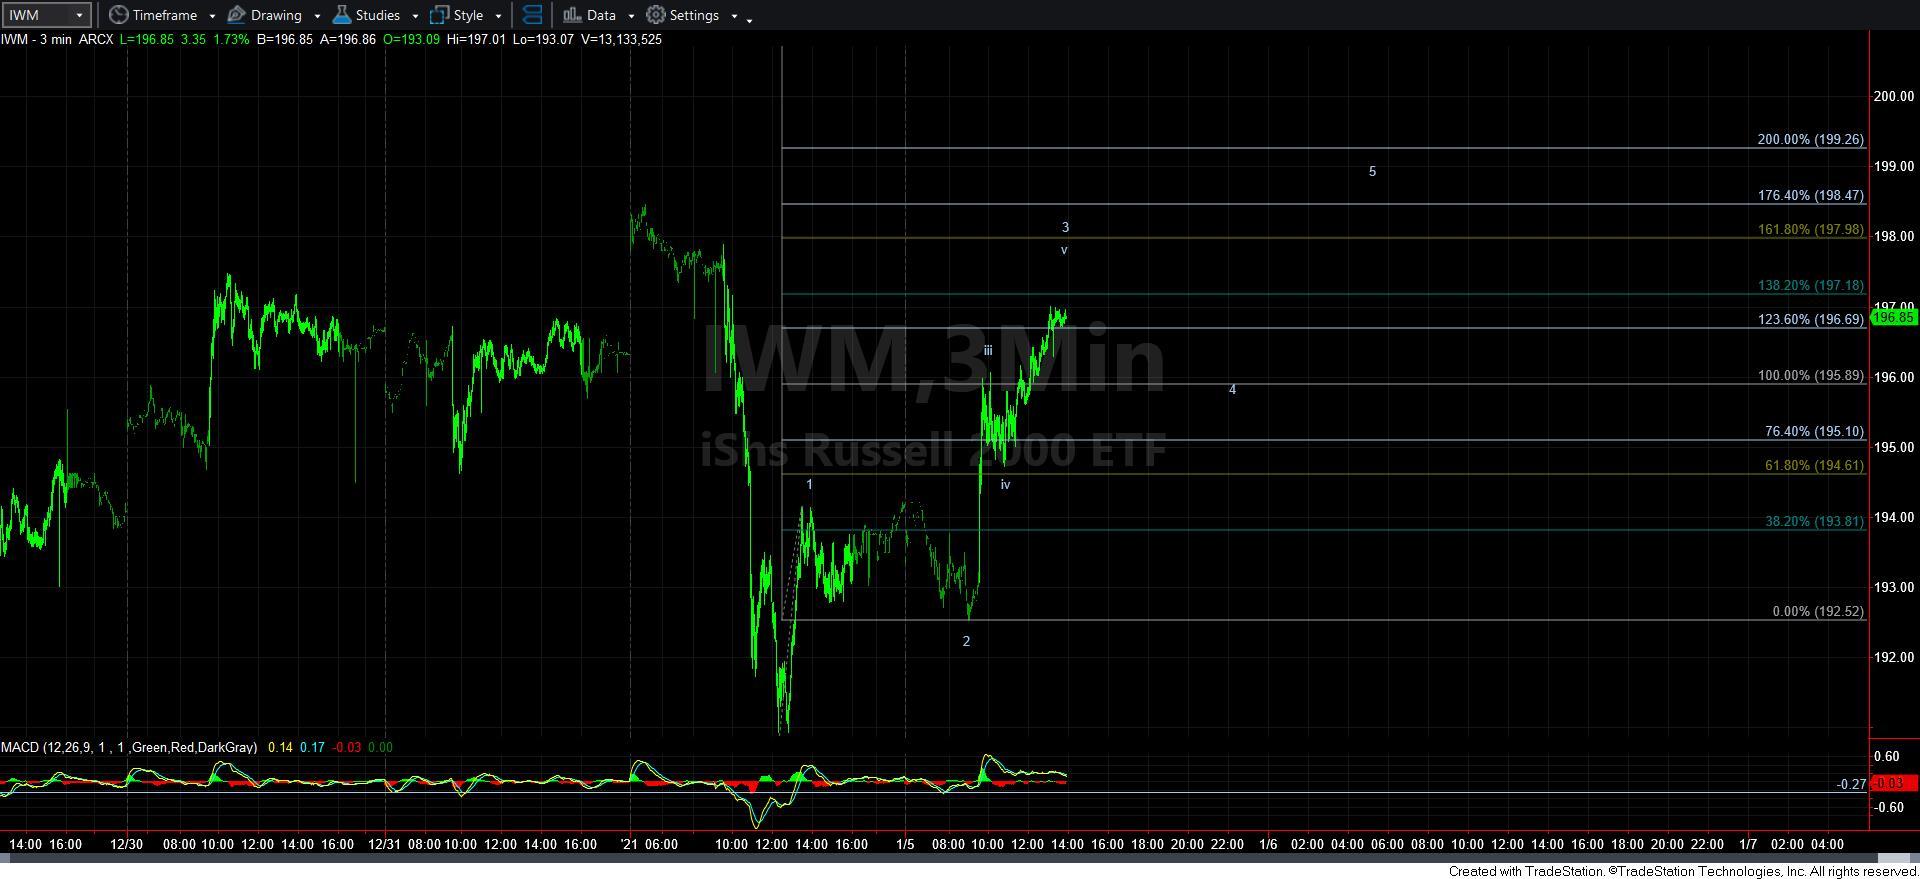
In fact, the SPX/ES looks quite overlapping off yesterday’s low, which makes me lean towards the yellow count pointing towards another drop. However, I am also tracking the 3-minute chart on the IWM, which still has strong potential to complete a 5 wave rally off yesterday’s low, assuming it fills in as outlined on the attached IWM chart. However, if we see a break down before this 5-wave structure completes, it strongly supports the potential for another loop lower before this pullback completes.
Please take note that this pullback is actually wave iv of 3of [3] in the IWM, as it is ahead in its wave count. Therefore, as I have outlined before I think the SPX will likely catch up in the next bullish phase for the market in the coming months.
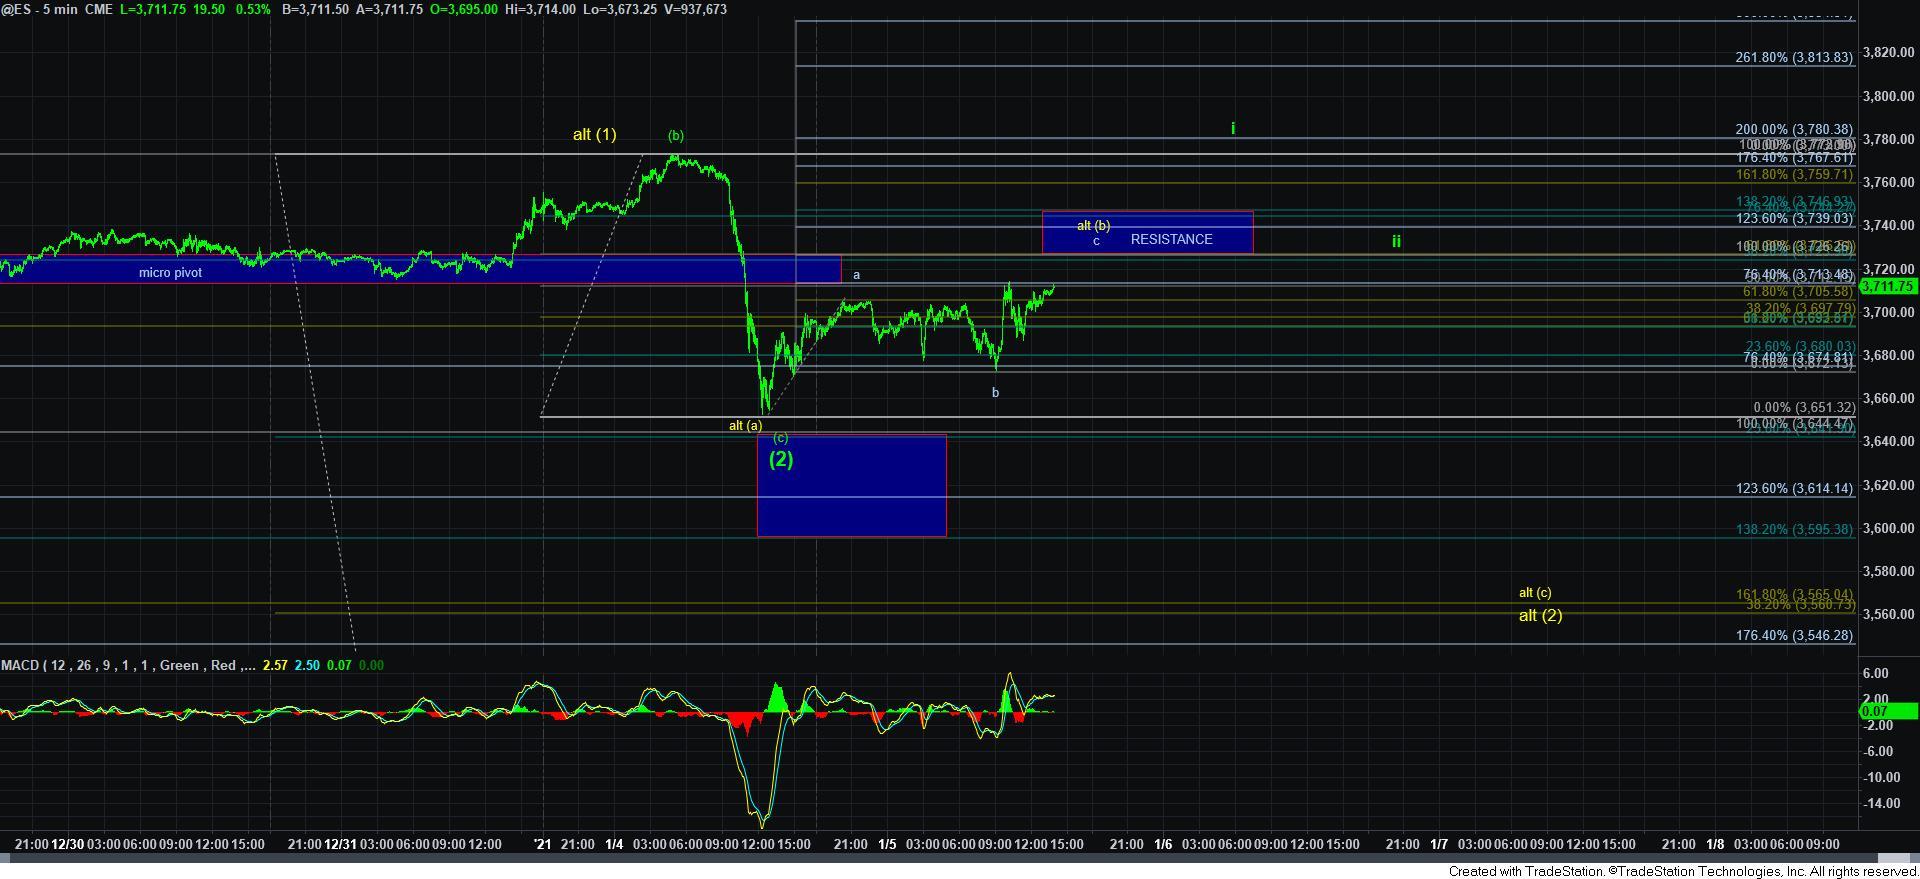
As far as the ES/SPX is concerned, I added a resistance region to the 5-minute ES chart between 3727-47ES. That resistance represents the .618-.764 retracement region of yesterday's decline, which also coincides with an a=c and c=1.382*a points within the current rally off yesterday's low. Until we can see a 5-wave rally take us through that resistance, pressure can certainly remain down for another drop, as presented in yellow.
In summary, we have been eagerly awaiting the market to provide us with a more reasonable wave [2] pullback in the SPX and our patience has paid off. The market has not yet made it clear that wave [3] has begun in the SPX, but as long as we remain below the noted resistance in 3727-47ES, the strong potential exists for another loop lower before we complete wave [2]. But, keep in mind, this is a bull market and surprises often come to the upside. Therefore, you should continue to focus on the individual stocks that are pulling back to their respective targets. Should the SPX provide us with a nice 1-2 set up for wave [3], then we can focus on a more aggressive long opportunity on the SPX.
5minES
5minSPX
60minSPX
3minIWM
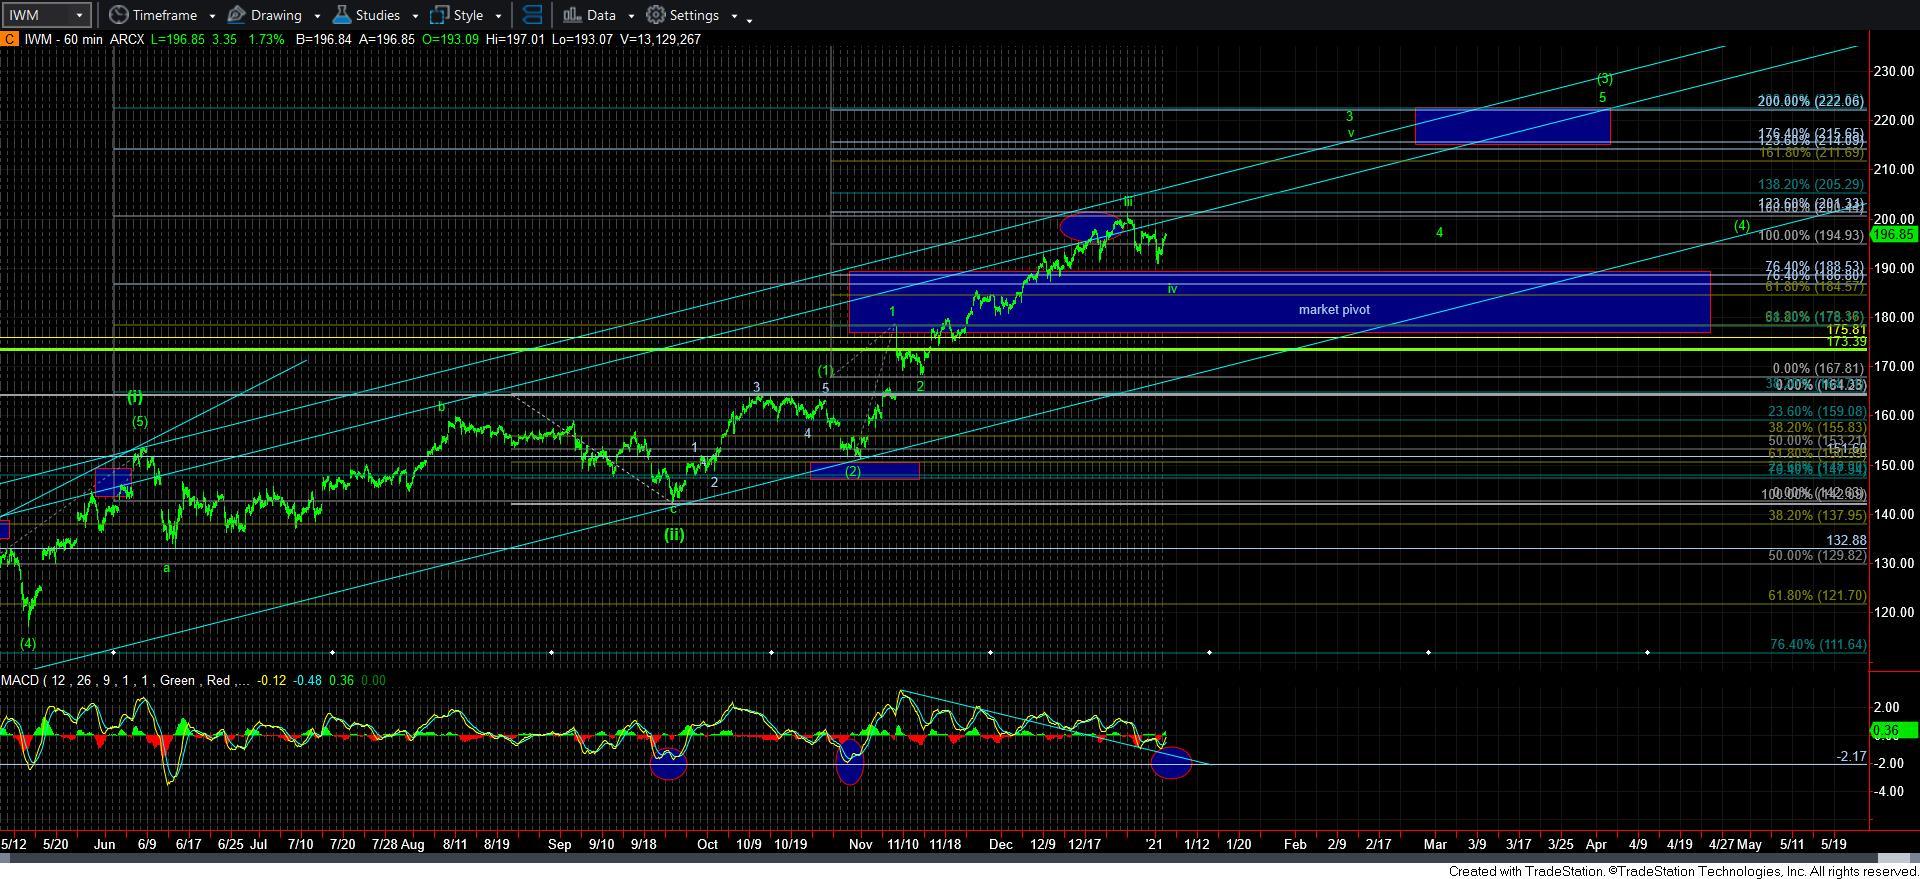
60minIWM
Avi Gilburt is a widely followed Elliott Wave technical analyst and author of ElliottWaveTrader.net ( more


