
Is It Time To Turn That Frown Upside Down?
To be sure, the action in the stock market has been sloppy for the better part of three months now. For example, the S&P 500 closed at 2163.75 on July 15 and at 2163.66 yesterday – can you say, sideways?
Yes, there has been some drama along the way as traders have fretted about the German banks, currency movements, interest rates, the Fed, the ECB, the economy, valuations, and of course, the election. Sentiment has become rather dour as almost no one has anything optimistic to say about the outlook for stocks – regardless of the time frame involved.
S&P 500 – Daily
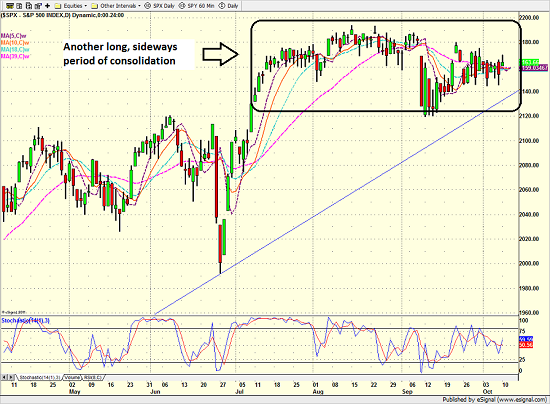
But I think it is also important to recognize that this sideways movement has occurred during what is traditionally a seasonally weak period of time. In other words, stocks have gone sideways instead of down during the mid-August through mid-October time frame. The chart below shows the S&P 500 (blue line) versus the cycle composite (red dashed line). See what I mean?
S&P 500 Daily vs. Cycle Composite
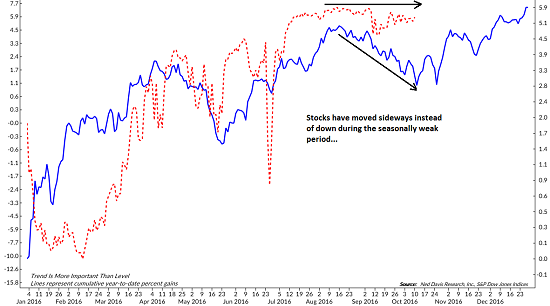
For me anyway, this is a reason to be optimistic. After all, there has been no shortage of worries during a period of time when stock normally go down. And yet, here we are – at the exact same spot we were in mid-July – and none the worse for wear.
Lest We Forget…
During such a long period of what I might term “misery” in the stock market, it is easy to lose track of the big picture. However, it is also important to recognize that stocks embarked on a new bull market on February 11, 2016.
Since the low on February 11, the Dow Jones Industrial Average has gained +17.04% over a period of 155 days. And with stocks near all-time highs the bears tell us we have nowhere to go but down – especially given the state of the traditional valuation metrics.
However, history might suggest otherwise.
Lest we forget, the current bull market is occurring within the context of a secular bull phase. And going back to 1900, history (and the computers at Ned Davis Research) shows the average gain of such bull markets to be +106.7% over a period of 1027 days.
S&P 500 – Daily
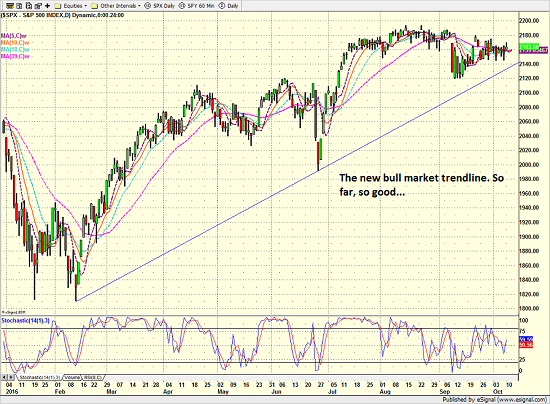
Granted, there is no guarantee that this particular market cycle will reflect the averages or even last another week. However, using history as our guide, we can argue that stocks have a long, profitable road ahead of them over the next couple of years.
So, with the cycle composite telling us that stocks are about to start moving higher, it might be time to think about making sure you are aligned for a change in the market’s tone in the coming months.


thanks for sharing