
Is Copper Reversing Lower From Multi-Decade Price Highs?
(Click on image to enlarge)
The price of Copper continues to be an indicator for the economic recovery, as well as emerging inflationary concerns.
We’ve seen Copper prices rip higher over the past several months (similar to 2009/2010). On one hand, this is signaling (and underscoring) the economic recovery. On the other hand, it may also be signaling inflation.
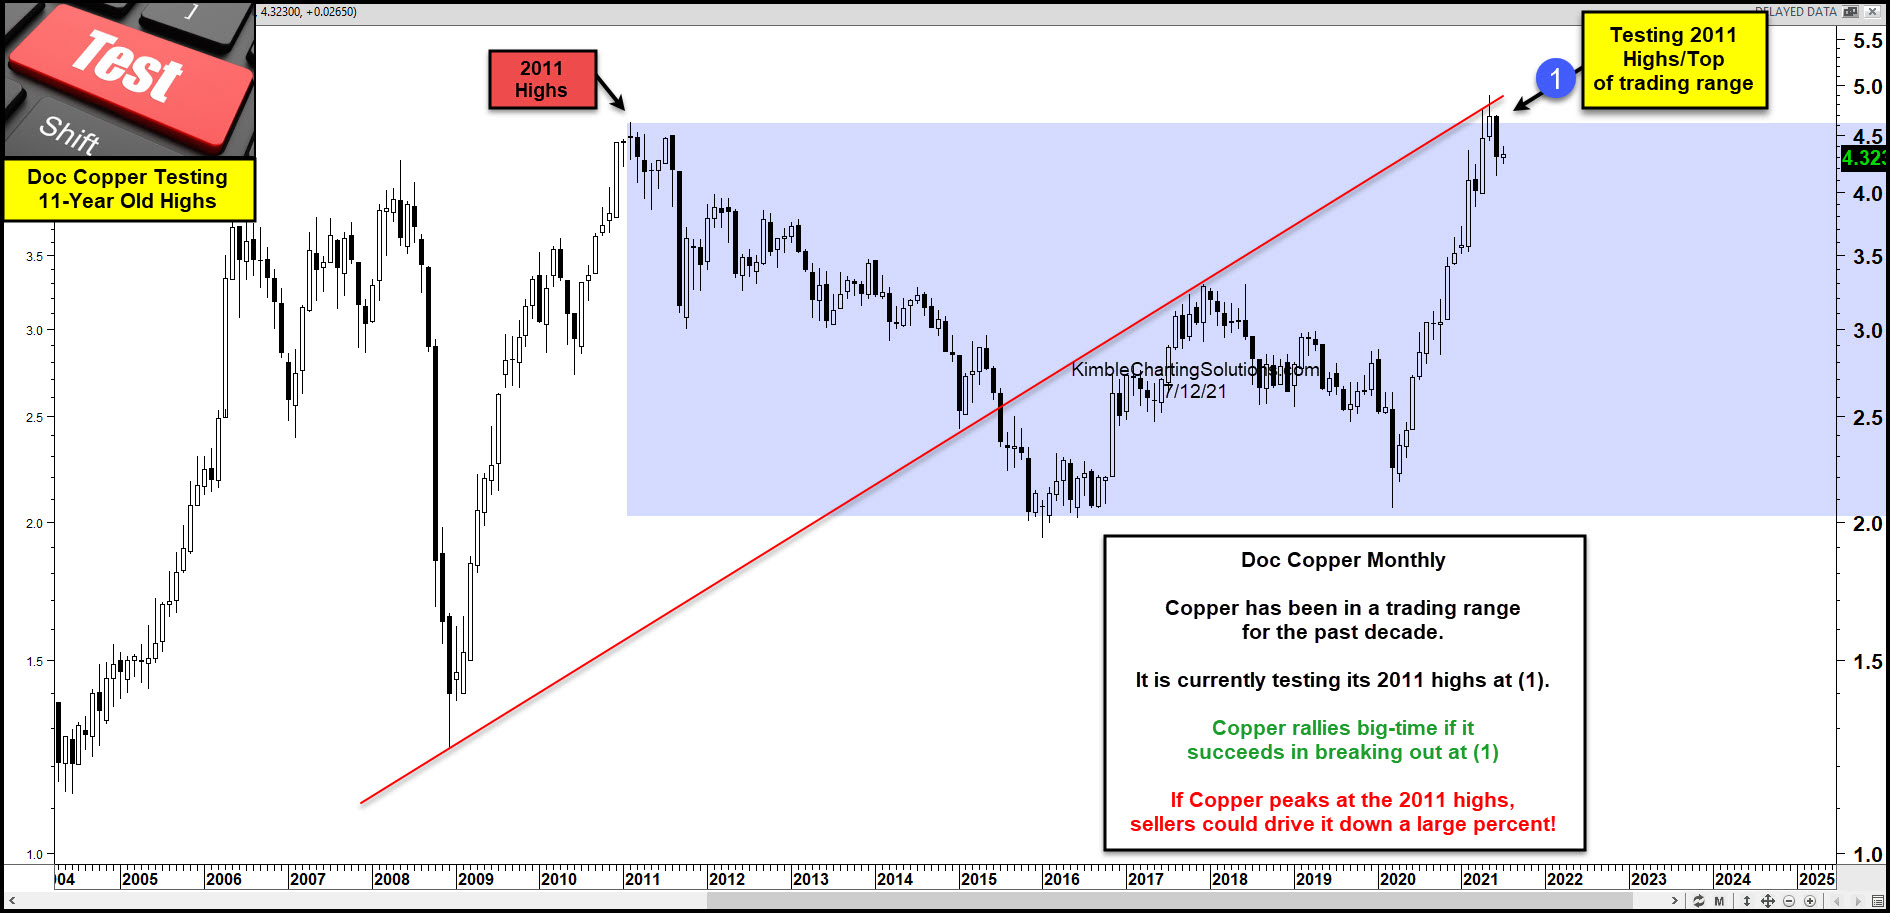
With many active investors beginning to worry about inflation, today we look at a long-term “monthly” price chart of good ole Doc Copper.
As you can see, Copper has been very strong since the coronavirus crash in 2020. That strength has taken copper all the way back up to its 2011 highs and a band of resistance at the top of its 10-year trading range at (1).
This is a big test of resistance for ole Doc Copper. Thus far, price has reversed lower and bears are trying to gain momentum for a steeper decline. But it’s still early… and if bulls can turn prices back higher and breakout above (1), it will be bullish for Copper and support the inflation narrative.
Disclosure: Sign up for Chris's Kimble Charting Solutions' email alerts--click here.


