
Is A Descending Triangle Pattern Forming In Bitcoin?
In early-January, I wrote a piece called “Watch This Bitcoin Triangle” in which I showed a triangle-shaped chart pattern that I believed foreshadowed another sharp move upon a breakout or breakdown from the pattern. Since then, Bitcoin has continued to consolidate and appears to still be forming this pattern, which looks like a descending triangle.
Descending triangles are continuation patterns that lead to further bearish action upon a successful break to the downside. The key levels to watch are the horizontal floor or support of the triangle pattern as well as $3,000, which is a key psychological level that many traders are watching. If Bitcoin can break below both of those levels in a convincing manner, even further bearish action is likely as the cryptocurrency bubble continues to unravel.
(Click on image to enlarge)
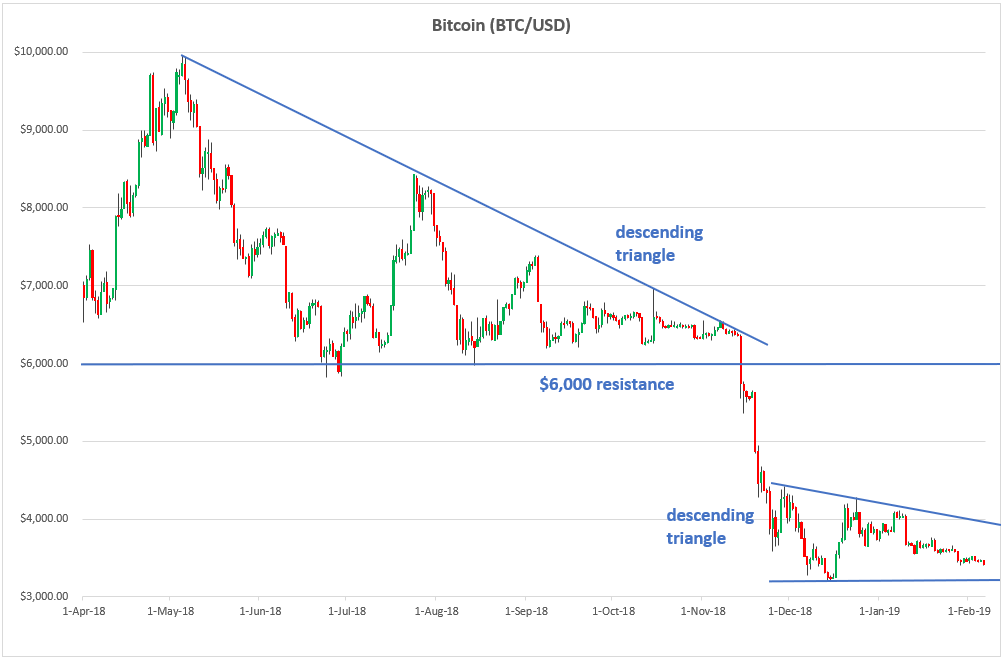
The weekly chart puts the latest descending triangle pattern into perspective:
(Click on image to enlarge)

For now, I am waiting for a confirmation in the form of a breakout or breakdown and I will continue writing these updates.
For the author's full disclosure policy, click here.


