
Investor Bullish Sentiment Lowest Since July 2020
This week's Sentiment Survey report by the American Association of Individual Investors showed bullish sentiment fell over 16 percentage points to 22.45% versus the prior week. This is the lowest bullishness reading since the end of July, 2020 reading of 20.23%. With that July, 2020 reading, the 8-period moving average of the bullishness reading equaled 26.15% and this compares to this week's 8-period moving average of 35.84%.
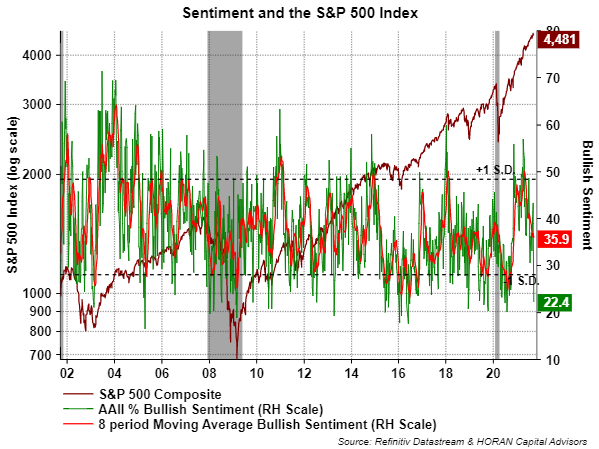
As in prior sentiment posts, the sentiment figures are contrarian ones, i.e., the low individual investor bullish sentiment indicator is a level that historically tends to be a positive indication for future stock returns. Also, sentiment measures like AAII's are most actionable at their extremes and certainly the 22.45% bullishness reading is near an extreme. The AAII reading can be volatile week to week so it is worthwhile taking into account the level of the 8-period moving average, which remains neither bullish or bearish as seen with the red line in the above chart.
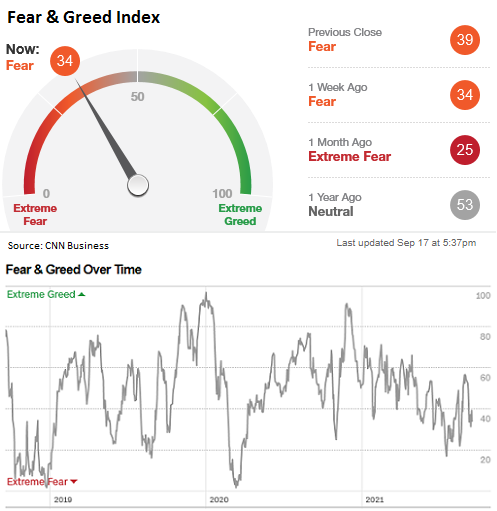
There are mixed points of view on the CNN Business Fear & Greed Index; however, I believe it is worthwhile to include in one of the sentiment indicators an investor reviews. The indicator incorporates seven indicators into one. Some of the indicators are the put/call ratio, junk bond demand and stock price momentum, just to name a few. The current reading of 34 falls in the fear range, yet not extreme fear as seen below.
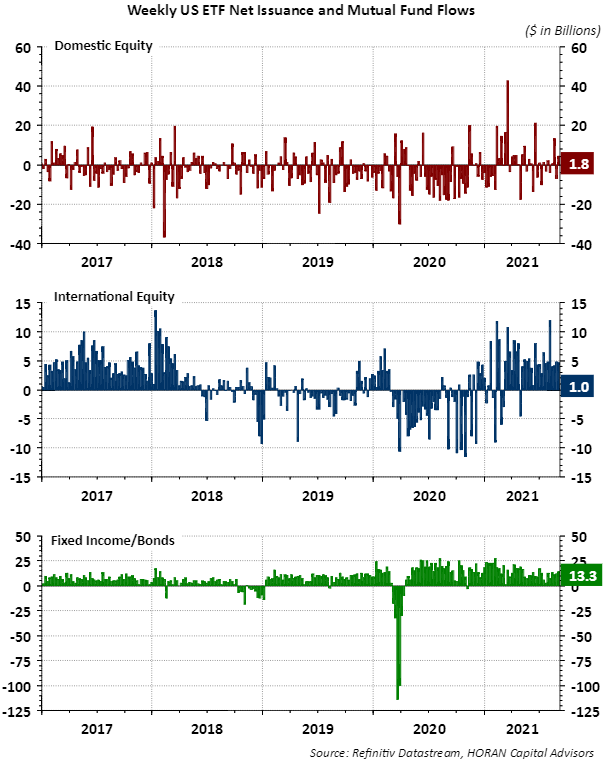
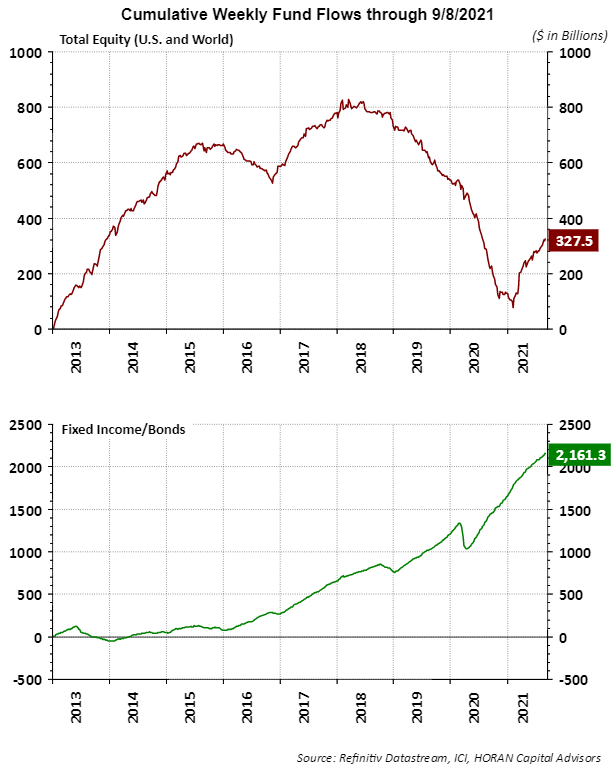
If individual investors are expressing less excitement about stocks, fund flows would be low or negative for equities. In fact the below chart shows mutual fund and ETF flows into equities as reported by the Investment Company Institute are lower than for bonds/fixed income investments. The second chart shows flows on a cumulative basis.
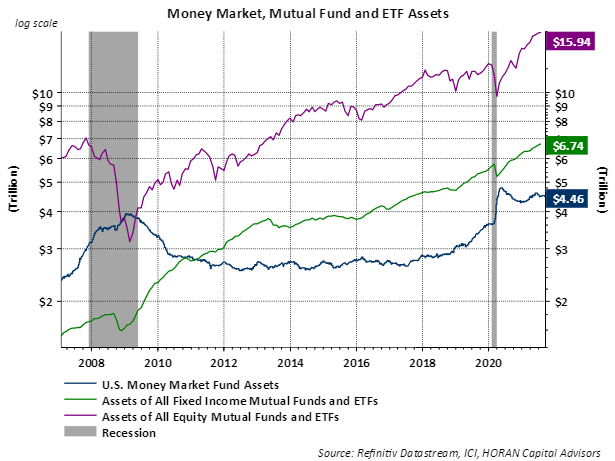
Lastly, a great deal of cash remains on the sidelines. The blue line in the below chart shows $4.5 trillion remains in money market funds, higher than the financial crisis in 2008/2009 and near the high reached in the pandemic shutdown market swoon. Is this cash being used to buy the so-called market dips?
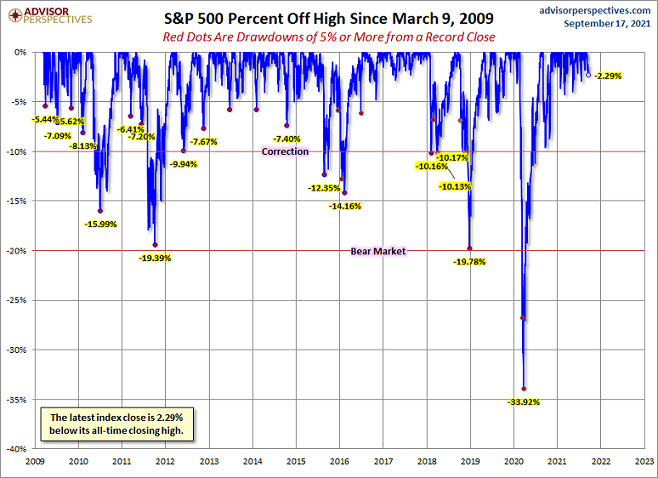
In conclusion, the market seems overdue for a more significant correction than experienced so far this year. The below chart shows the S&P 500 Index (SPX) has not experienced a pullback of 5% or more this year and this size of a pullback is more the rule than the exception in a given year.
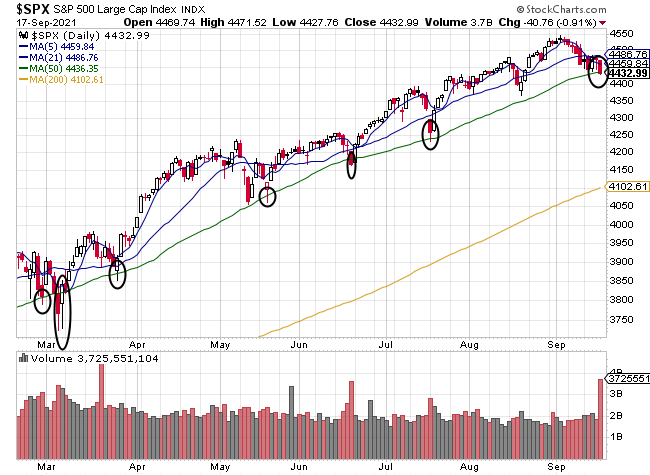
And as much as the market seems overdue for a pullback, the below chart shows the S&P 500 Index is in an area where it just might find support at the Index's 50-day moving average.
Disclaimer: The information and content should not be construed as a recommendation to invest or trade in any type of security. Neither the information nor any opinion expressed constitutes a ...
more

