Inflation And Average Earned Income In The U.S.
Earlier this year, we introduced a new near-real time economic indicator based on average individual earned income. The metric itself is almost as simple as it comes. It is determined by dividing the aggregate received wages and salaries for individuals in the U.S. by the nation's estimated resident population.
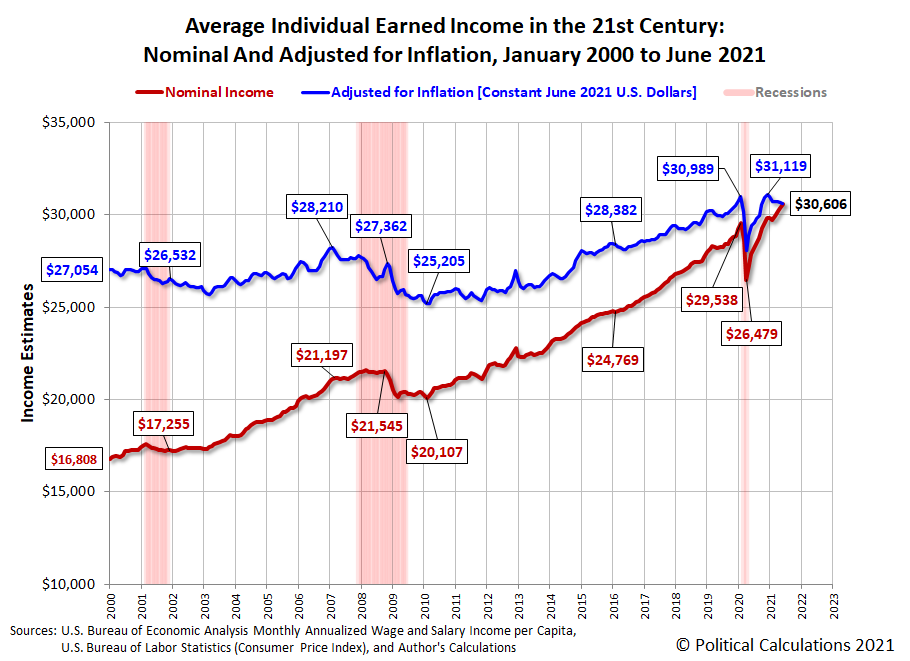
That introduction represents a snapshot in time from January 2021. Half a year and a significant revision in the source income data later, we now have data through June 2021. Here's the new snapshot through that more recent point in time, showing all updated data from January 2000 onward.
The updated chart shows some remarkable events, particularly during the coronavirus recession and the period since:
- Nominal (not inflation adjusted) earned income (red) peaked at $29,538 in February 2020 as the U.S. economy peaked just ahead of 2020's coronavirus pandemic lockdowns that threw the nation into recession. They bottomed at $26,479 in April 2020, marking the bottom of the Coronavirus Recession. The inflation-adjusted data (blue) shows nearly the same pattern in 2020. In terms of constant June 2021 dollars, average income per capita in the U.S. peaked at $30,989 in February 2020, bottomed at $28,059 in April 2020.
- Average nominal income recovered to its pre-Coronavirus Recession peak in November 2020, and in December 2020 for the inflation-adjusted data.
- Nominal average earned income per capita has continued to rise to $30,606 through June 2021 based on the month's initial estimate.
- After adjusting for inflation, real average earned income earned income per capita has fallen by 1.6% from its December 2020 peak of $31,119. The bulk of the decline has taken place since January 2021, with high rates of inflation eroding the purchasing power of American wage and salary earners. Their purchasing power is roughly at the level it was in December 2019, despite average earned income per capita in June 2021 being 6% higher than December 2019 in nominal terms.
So what has happened in 2021? Tyler Cowen offers an explanation:
You may remember that I’ve been predicting that repeatedly, while much of “Twitter economics” was suggesting that “running the labor market hot” would boost real wages, I was claiming it was far more likely that rising employment would be correlated with falling real wages. (Try here.) This did not represent any great insight on my part, rather I was simply refusing to make the mood affiliation move of denying the tradeoff, and I had read Keynes’s General Theory. Here is the latest:
Companies big and small are raising wages to attract workers and hold onto employees as the economy revs back into gear.
But those fatter paychecks aren’t going as far, thanks to rising inflation.
In fact, compensation is now lower than it was in December 2019, when adjusted for inflation, according to an analysis by Jason Furman, an economics professor at Harvard University.
The Employment Cost Index — which measures wages and salaries, along with health, retirement and other benefits — fell in the last quarter and is 2% below its pre-pandemic trend, when taking inflation into account. (Wages and salaries are growing at a faster pace than benefits.)
Score one for Keynesian economics > Twitter economics.
Or maybe they didn’t run the labor market hot enough.
Gotta love that last dig!
References
U.S. Bureau of Economic Analysis. Table 2.6. Personal Income and Its Disposition, Monthly, Personal Income and Outlays, Not Seasonally Adjusted, Monthly, Middle of Month. Population. [Online Database (via Federal Reserve Economic Data)]. Last Updated: 30 July 2021. Accessed: 30 July 2021.
U.S. Bureau of Economic Analysis. Table 2.6. Personal Income and Its Disposition, Monthly, Personal Income and Outlays, Not Seasonally Adjusted, Monthly, Middle of Month. Compensation of Employees, Received: Wage and Salary Disbursements. [Online Database (via Federal Reserve Economic Data)]. Last Updated: 30 July 2021. Accessed: 30 July 2021.
U.S. Department of Labor Bureau of Labor Statistics. Consumer Price Index, All Urban Consumers - (CPI-U), U.S. City Average, All Items, 1982-84=100. [Online Database (via Federal Reserve Economic Data)]. Last Updated: 13 July 2021. Accessed: 13 July 2021.


