
How To Track A Capital Rotation Event In Three Charts

Image Source: Unsplash
“Are we in a capital rotation?” I think I’ve been asked that question more in the past week than at any time in the past 20 years.
Most investors just aren’t typically attuned to seismic shifts in sentiment, but maybe the retail investor community is finally catching on!
The idea of a capital rotation event has been around for a long time. Typically, technical analysts call this “sector rotation”, but one thing about language is that it’s always changing. While language changes, the underpinnings of rotation indicators don’t.
Here’s how to track and understand what’s happening as it unfolds but before the rest of the market figures it out…
How to Understand Capital Rotation Signals
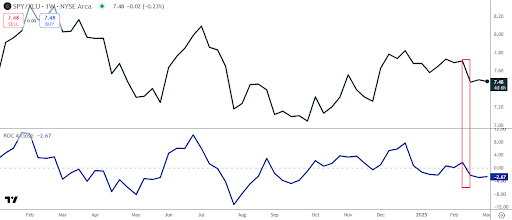
SPY/XLU Ratio: One of the most time-tested bear signals is the rotation into the Utilities sector. One approach is to look at a four-week rate-of-change (ROC) of a ratio of SPY to XLU. This is a binary strategy where you hold either SPY or XLU based on which is outperforming in the prior 4-week period.
In the chart below, you’ll see the ROC cross zero on the week of February 17, 2025. That means that XLU has outperformed over the prior four-week period. This is a bearish signal for the market as institutions rotate into the most defensive sector.
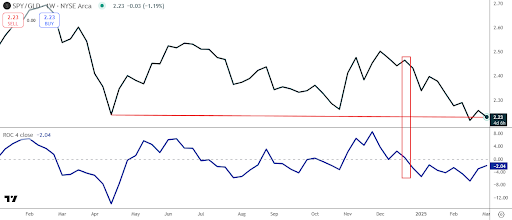
SPY/GLD Ratio: While comparing the SPY to XLU is about sector rotation, this ratio is about S&P 500 value. One of the biggest bullish catalysts is a weak dollar. While the market tends to melt-up in these circumstances, oftentimes the value of the S&P 500 erodes as its purchasing power doesn’t hold up.
Taking a ratio of the SPY to XLU will reflect whether the market is increasing in value rather than just price. Since gold is a negative yielding asset over time, the erosion of value relative to gold is a big warning sign. In this case, the ratio of SPY to GLD broke in favor of GLD on December 30, 2024 using the same 4-week ROC. Essentially, the SPY is trading at a similar value as it did in April 2024.
XLY/XLP Ratio: This ratio weighs two diametrically opposed sectors. Consumer discretionaries (XLY) are cyclical and tendd to do well during periods of economic expansion. The other, consumer staples (XLP), is the steady one with inelastic demand leading to consistent earnings and cash flows.
On February 3, 2025 the four-week ROC flipped for the first time since last July. The rotation from cyclicals to non-cyclicals (consumer staples) has been furiously felt over the past few weeks since the ROC crossed over on February 3, 2025.
(Click on image to enlarge)

The takeaway from these three charts are that Institutions are rotating to defensive parts of the market and that the S&P 500 is eroding in value and has been for a while now. The rotation to gold and defensive sectors will take time to play out. Even if we see a short squeeze today, the rallies can easily and may likely be sold.
First Mover Option Pulse
We’re looking for a first-mover advantage by identifying option pulses or prints that could impact the stock price. Here are three that I thought were significant yesterday:
Option Pulse #1
Range Resources Corp (RRC)
Where is natural gas headed? One of the themes that I have been watching is a rotation to resource-oriented companies. Natural gas futures (/NG) pulled back following its breakout in early February, but the price is setting up for a higher low, which may be pointing to a near-term rally in RRC.
- RRC 19 SEP 25 $46 calls
The slightly longer-dated September calls were bought, which doesn’t produce a high degree of gamma, but the trade is an example of money flowing into RRC vis-à-vis the options market. Continued strength may allow RRC to retest its January high near $42, but may have a chance to move beyond toward the 2016 high near $46.
Option Pulse #2
Kinder Morgan Inc (KMI)
In last Thursday’s edition of the First Mover Market Advantage newsletter, I reviewed an option pulse in KMI. That activity resumed last Friday and is another indication of the short-term bullish interest in KMI.
- KMI 14 MAR 25 $28.50 call
The near-term expectation is for the price to test $28, but a bigger move to $31.50 is a possibility.
Option Pulse #3
iShares 20 Plus Treasury Bond ETF (TLT)
What is more endemic of capital rotation than moving from stocks to bonds. The relative outperformance of bonds since the February 19, 2025 low has been profound and has flown in the face of inflation data that has exceeded the Fed target of 2%. Maybe the inflation fears regarding tariffs may be unfounded if we’re about to see a significant economic weakness.
- TLT 16 JAN 26 101/106 long call vertical
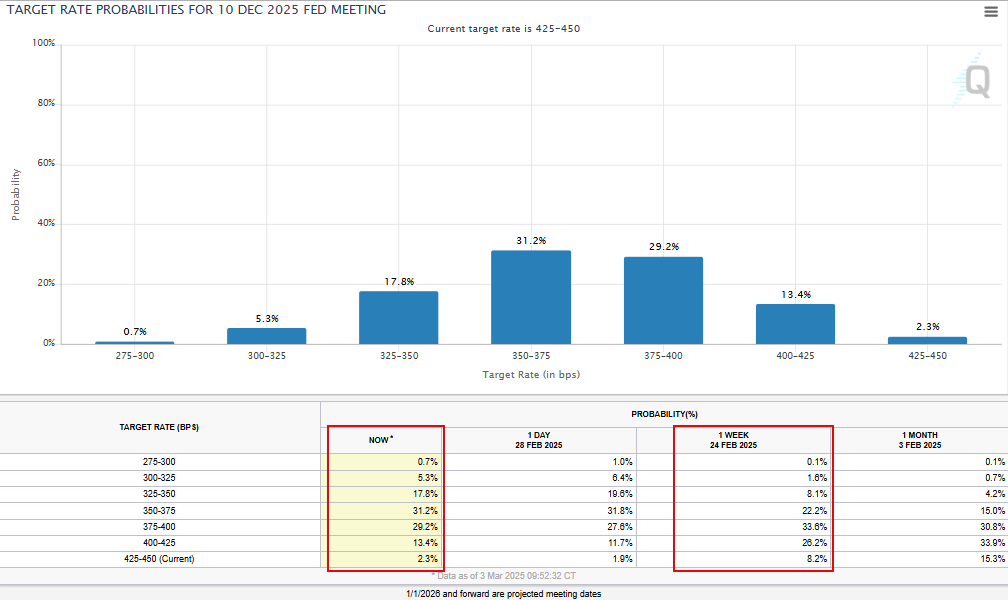
This option trade is similar to the one I highlighted last week, it’s about inflation fears being over-hyped, recessionary fears and the Fed cutting rates. Since Secretary Bessent’s comments last week, the futures are pricing in more cuts by December 2024 from the week earlier.
(Click on image to enlarge)
Like last week, the trade is considering a longer-dated long call vertical using the favorable volatility skew. However, going long the long bond is also a reasonable investment based on the thesis of potentially lower rates and a weaker economy moving forward throughout the year. If the Fed goes back to zero interest rate policy (ZIRP), we may be talking about a $170-$180 handle on TLT.
(Click on image to enlarge)

More By This Author:
Making Bets On The MoneyThe DOGE Effect: Five Stocks Set For Big Moves Courtesy Of Musk And Trump
How To Do What I Do When The Market Drops
Disclaimer: Neither TheoTrade or any of its officers, directors, employees, other personnel, representatives, agents or independent contractors is, in such capacities, a licensed financial adviser, ...
more

