

Image Source: Unsplash
Here is how to apply Wyckoff’s efforts vs results to spot the hidden demand in S&P 500 and Wyckoff structure and price analysis for the long and short-term direction for S&P 500.
Despite the presence of the hidden demand, do pay attention to the characteristics of the price as explained in the video below should the bullish scenario is violated.
Video Length: 00:11:45
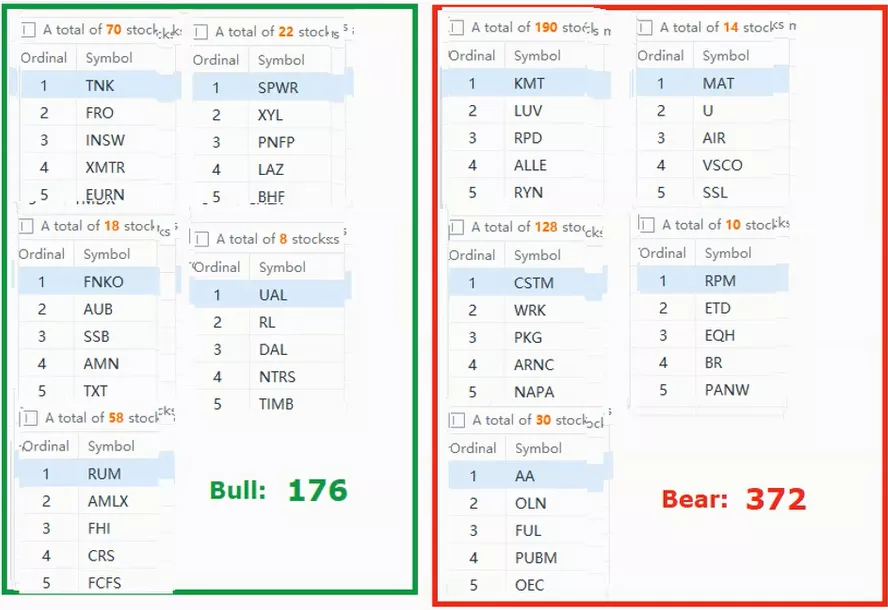
The bullish setup vs. the bearish setup is 176 to 372 from the screenshot of my stock screener below. Despite the recent market pullback, outperforming stocks still buck the trend. However, the bull only focused on the selective industry groups and stocks, which posed a challenging trading environment as the market breadth is still deteriorating.
High volatility is not uncommon for the market bottoming scenario as explained by the market bottom indicator using the breadth thrust as a “momentum starter”.
Thus, it is essential to pick the winning stocks in the strong sectors in order to profit in this volatile market, and most importantly, to beat the market in the long run.
More By This Author:
Here Is How To Use Relative Strength To Predict The Next Big Move In Tesla
Here Is How To Pick Winning Stocks To Outperform In A Bear Market Or Market Correction
Wyckoff Accumulation In Bitcoin Reveals Risk On Sentiment Ahead


Comments
Log in or sign up to join the conversation.