
How Reported New Home Median Sale Prices Change Over Time
Yesterday, the U.S. Census Bureau released its latest data on the average and median sale prices of new homes in the United States, with the newest data being reported for September 2016.
Much less noticed, the Census Bureau also revised each of the new home sale prices it previously reported over the preceding three months, affecting the data reported for June 2016, July 2016 and August 2016. Depending upon your media source, you may only have been aware of as many as two of those revisions of previous data.
Those revisions are a regular practice of the U.S. Census Bureau, which provides an initial estimate for the sale prices of new homes for each month it reports before revising it three more times over the next three months, where the fourth estimate represents the final estimate it publishes.
We became curious to see how much the estimates changed from first through fourth estimate, so we began tracking them beginning with the initial estimate published for December 2014. The results of that project are visually presented in the following chart, which shows a pretty remarkable pattern for the Census Bureau's reported median new home sale prices from their first through fourth and final estimate that receives almost no attention in the media.
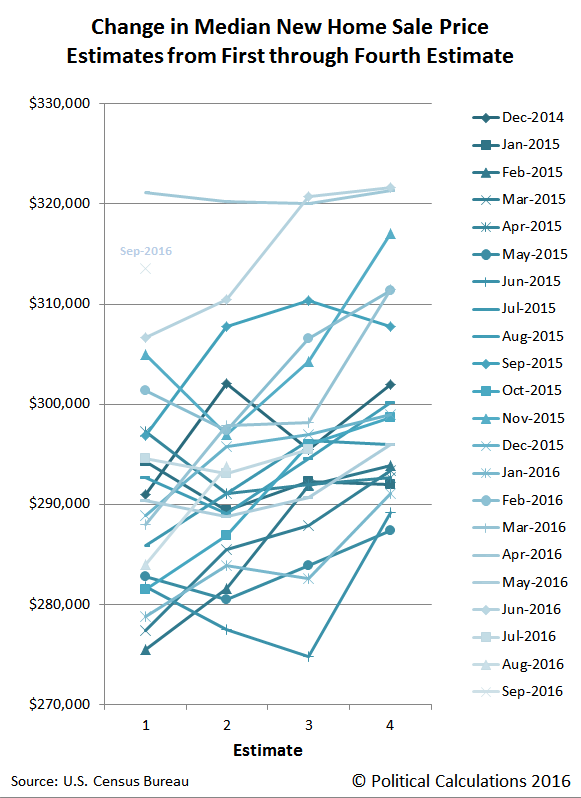
Four the 19 months for which we have four estimates of new home sale prices, spanning December 2014 through June 2016, we see that the second revision is the only one where the prices are more likely to be revised downward than upward, with 52% (10 of 19) being changed that way. After the second revision however, the upward revisions dominate, with 79% (15 of 19) of third revisions being adjusted above the second revision, and 84% (16 of 19) of fourth revisions being adjusted to be larger than the third revision.
Cumulatively, those adjustments combine to produce the result where 89% (17 of 19) of the fourth and final estimate is reported to be higher than the initial estimate. Over the period of time for our sample, the final estimate is on average some 3.3% higher than the initial estimate, although that ranges from a low of -1.5% to a high of 8.1%.
As the Census Bureau reports and revises its data, it reflects the increasing amount of information it has on the number of new home sales and their sale prices. Often, its initial estimates omit data for homes that have sold for higher prices, which tend to take longer to be reported, which would explain why the later estimates tend to be revised upward over time.
But perhaps the real question is why is that second estimate adjusted downward so much more often in comparison to later estimates?
Disclosure: None.


