
How Helpful Are Two Consecutive S&P 500 Inside Weeks?
Rare Occurrence On S&P 500’s Weekly Chart
The S&P 500’s weekly chart did something recently that indicates investor confusion and indecisiveness. From CNBC:
The S&P 500 just experienced two “inside weeks” in a row for the first time since February 2008, an indication that the market may be in for a major breakdown or breakout in the weeks ahead. Inside weeks are unusual, but two inside weeks in a row is rare indeed. The last time the market created such a Russian-doll-like trading pattern was in February 2008; the two prior occurrences were in June 2007 and January 2000, according to Ryan Detrick, a technical analyst with LPL Financial.
June 2007 Example
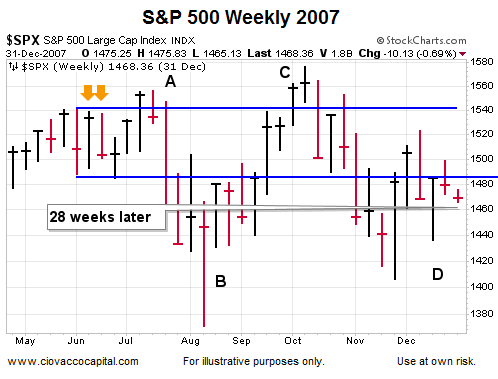
From a longer-term perspective, did the S&P 500 immediately start a clearly-defined downtrend after the two inside weeks that occurred in June 2007?
The two inside weeks are shown via the orange arrows in the chart below. The S&P looked like it was initially breaking out to the upside with the move to point A. However, that move proved to be a false breakout since price then plunged toward point B. No clear direction was evident yet as price then rallied sharply back to point C. The push to a new weekly high did not come with a bullish follow-through, instead the S&P 500 dropped to point D. Following the two consecutive inside weeks, it took another 28 weeks for the market to begin the first discernible and lasting leg down in the 2007-2008 bear market.
February 2008 Example
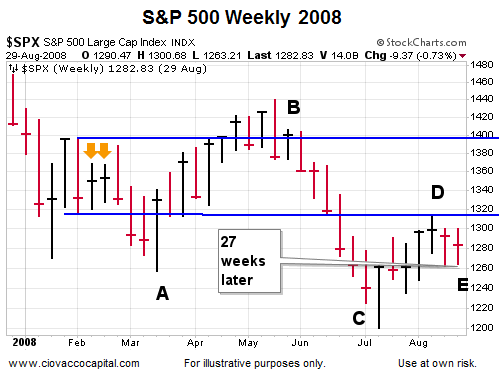
In the wake of the consecutive inside weeks in early 2008, the S&P 500 appeared to break down in a bearish manner as it dropped to point A. However, that proved to be a false breakdown as the S&P 500 rallied to point B. The move to point B also proved to be short-lived as stocks reversed hard and dropped to point C. From point C, one more multiple-week rally to point D occurred before a more discernible downtrend began following point E. After the inside weeks, the longer-term downtrend did not begin for 27 weeks.
January 2000 Example
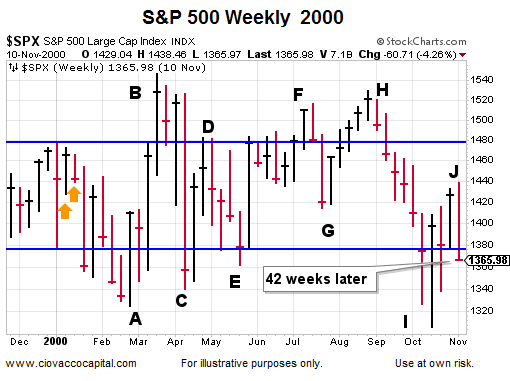
How long did it take for the market make up its mind regarding a longer-term trend following the two inside weeks that occurred in January 2000? Following the inside weeks, the S&P 500 bounced around like a lottery ping pong ball before deciding on a more discernible trend 42 weeks later.
Moral Of The Story
The inside weeks did occur in calendar years that were marked by longer-term trend changes. However in the 2000, 2007, and 2008 examples above, it would have been very difficult to use the rare occurrence in a meaningful way since stocks bounced around for an average of 32 weeks before deciding on the direction of the longer-term trend.
Game Plan Remains Unchanged
Based on the facts in hand, we eliminated the weakest position from our portfolios Tuesday. With three Fed-related events coming Wednesday, we will proceed in a manner similar to the approach described on October 6.
Disclosure: This post contains the current opinions of the author but not necessarily those of Ciovacco Capital Management. The opinions are subject to change ...
more


Thanks