
How Bad Will The Big, Bad Bond Bear Get?
In yesterday’s meandering morning market missive, we talked about the possibility of the bond market entering a big, bad bear cycle and how a great many analysts expect things to get ugly in the coming years for bond investors.
The thinking is actually quite logical. The economy is expected to improve, which will cause inflation to rise. And the bottom line is that the bond market hates nothing more than increasing inflation expectations. Now toss in the fact that the Fed wants to start “reducing its balance sheet” (i.e. selling some of the approximately $4 trillion in bonds and other fixed income securities it owns) and you appear to have a perfect storm for bond bears.
Put simply, the stage appears to be set for a rising interest rate environment, which could be accompanied by additional supply (from the Fed). And since bond prices fall when rates rise, it is easy to see how things could get nasty for the owners of bond funds and ETFs.
But before you run out and start loading up on those levered, inverse bond ETFs in the hopes for some “no brainer” gains for many years to come, it might be a good idea to look back at history and see how the bond market acted during periods of rising rates.
How Bad Will It Get?
To review, bonds enjoyed a 35-year secular bull market cycle from 1981 through July 2016. During this period of time, you may be surprised to learn that according to Bloomberg, the worst calendar year for the Barclays Aggregate Bond Index (the generally accepted benchmark for the overall bond market) was 1994, where the “Agg” lost -2.9%. Then in 1999, the Agg lost -0.8%. And in 2013, the bond market declined by -2.0%. That was it for calendar year declines over the 35-year bull cycle. Terrifying, eh?
But… this was during a secular bull phase. Now let’s go back and look at periods of time when rates were generally rising such as 1955-1959, 1967-1969, and 1972-1981.
A Powerful Chart
To aid in the exercise, below is a powerful chart from Fidelity Institutional Asset Management showing the yield of the 10-year Treasury (the black line) as well as the calendar year returns of the Agg going back to 1940. Note that since the Agg didn’t exist prior to 1976, the returns from 1940 through 1975 are based on Fidelity’s “Synthetic Aggregate” which is made up of 67% intermediate government bonds and 33% long-term corporate bonds.
From my seat, this is a VERY powerful chart that EVERY investor and financial advisor needs to see – and study – prior to making ANY moves in preparation for the upcoming bond bear.
(Click on image to enlarge)
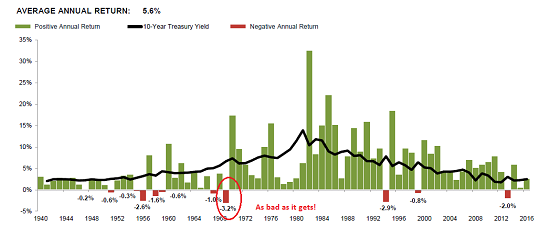
The first big takeaway is the absolute WORST calendar year the bond market (as defined by the Barclays Agg and Fidelity’s synthetic Agg) has seen since 1940 was… wait for it… -3.2%. Yep, that’s right, the biggest decline in modern history for the bond market occurred in 1969, where the market fell a little over 3%.
Folks, a 3.2% decline is a bad week for the stock market indices, a pretty good reaction to a stock missing earnings, and a bad afternoon for a lot of commodities. But the reality is this is the worst calendar year decline the bond market has ever seen. So, my question is, what the heck is everybody so worried about?
Digging deeper, we find that there have been other tough times to own bonds. For example, in 1955, the synthetic Agg lost -0.3%. Then in 1956, it fell -2.6%. 1958 saw a decline of -1.6% and 1959 lost -0.6%. As such, bond investors saw declines in four out of five years. Ughh.
However, in 1957, bonds rallied about 8%. So, according to my calculator, the cumulative return for the five-year period was somewhere in the vicinity of +2.5%.
Then there was another rough patch for bond investors in the late 1960’s. In 1967, the synthetic agg fell -1.0%. And in 1969 bonds had their worst year ever at -3.2%.
And then there was the 1972 through 1981 period, where the yield on the 10-year rose significantly from about 6% to nearly 15%. And how did bonds do during what can only be described as a horrific period of rising rates and runaway inflation? They rose. Every single year. So, again, what exactly is everyone so freaked out about?
Bonds Will Still Be Bonds
It is also worth noting that one of the major reasons to own bonds in a diversified portfolio (besides the production of income, that is) is bonds (especially government bonds) remain the one asset class that is truly non-correlated to the stock market. I.E. when the stock market tanks as it did in 1987, 1990, 1998, 2000-02, and 2008-09, bonds rose – every single time.
So, unlike developed foreign markets, emerging markets, commodities, real estate, junk, lots of alts, etc., high quality bonds provide a hedge against the big, bad stock market bears, which unlike their bond counterparts, have actually done a great deal of damage to portfolios over the years.
For me, the bottom line here is simple. While the outlook for the bond market can be made to look bleak, I’m not sure there is a whole lot to fret about. Sure, bonds will experience stiff headwinds at times and may even produce record calendar year declines. But even if the Agg doubles its worst year in history, the benefits would seem to outweigh the costs – well, in my book anyway.
Thought For The Day
May your actions speak louder than your words. May your life preach louder than your lips. May your success be your noise in the end.
Current Market Drivers
We strive to identify the driving forces behind the market action on a daily basis. The thinking is that if we can both identify and understand why stocks are doing what they are doing on a short-term basis; we are not likely to be surprised/blind-sided by a big move. Listed below are what we believe to be the driving forces of the current market (Listed in order of importance).
1. The State of Trump Administration Policies
2. The State of the U.S. Economy
3. The State of Earning Season
Disclosure: At the time of publication, Mr. Moenning and/or Sowell Management Services held long positions in the following securities mentioned: none. Note that positions may change at any ...
more

