Housing Starts Drop 6.6 Percent On Top Of Negative Revisions
(Click on image to enlarge)

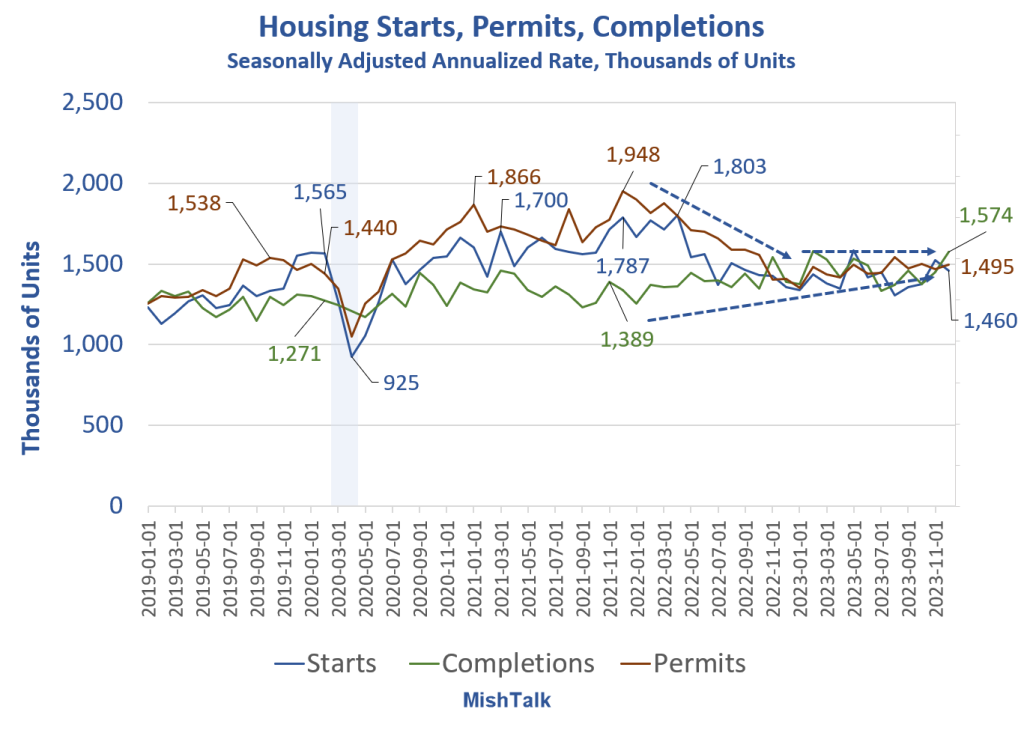
Housing data from Census Bureau, chart by Mish.
Housing starts dropped 6.6 percent in December according to the Census Bureau’s New Residential Construction Report.
Building Permits
- Privately-owned housing units authorized by building permits in December were at a seasonally adjusted annual rate of 1,495,000. This is 1.9 percent above the revised November rate of 1,467,000 and is 6.1 percent above the December 2022 rate of 1,409,000.
- Single-family authorizations in December were at a rate of 994,000. This is 1.7 percent above the revised November figure of 977,000.
- Authorizations of units in buildings with five units or more were at a rate of 449,000 in December. An estimated 1,469,800 housing units were authorized by building permits in 2023. This is 11.7 percent below the 2022 figure of 1,665,100.
Housing Starts
- Privately-owned housing starts in December were at a seasonally adjusted annual rate of 1,460,000. This is 4.3 percent (±12.5 percent) below the revised November estimate of 1,525,000, but is 7.6 percent (±17.6 percent) above the December 2022 rate of 1,357,000.
- Single-family housing starts in December were at a rate of 1,027,000; this is 8.6 percent (±11.2 percent) below the revised November figure of 1,124,000.
- The December rate for units in buildings with five units or more was 417,000. An estimated 1,413,100 housing units were started in 2023. This is 9.0 percent (±2.5 percent) below the 2022 figure of 1,552,600.
Housing Completions
- Privately-owned housing completions in December were at a seasonally adjusted annual rate of 1,574,000. This is 8.7 percent (±19.9 percent) above the revised November estimate of 1,448,000 and is 13.2 percent (±17.7 percent) above the December 2022 rate of 1,390,000.
- Single-family housing completions in December were at a rate of 1,056,000; this is 8.4 percent (±18.5 percent) above the revised November rate of 974,000. The December rate for units in buildings with five units or more was 509,000.
- An estimated 1,452,500 housing units were completed in 2023. This is 4.5 percent (±3.8 percent) above the 2022 figure of 1,390,500.
Margins of Error
Note the margins of errors on starts (±12.5 percent)and completions (±19.9 percent).
The Census Department has little faith in the numbers and neither do I.
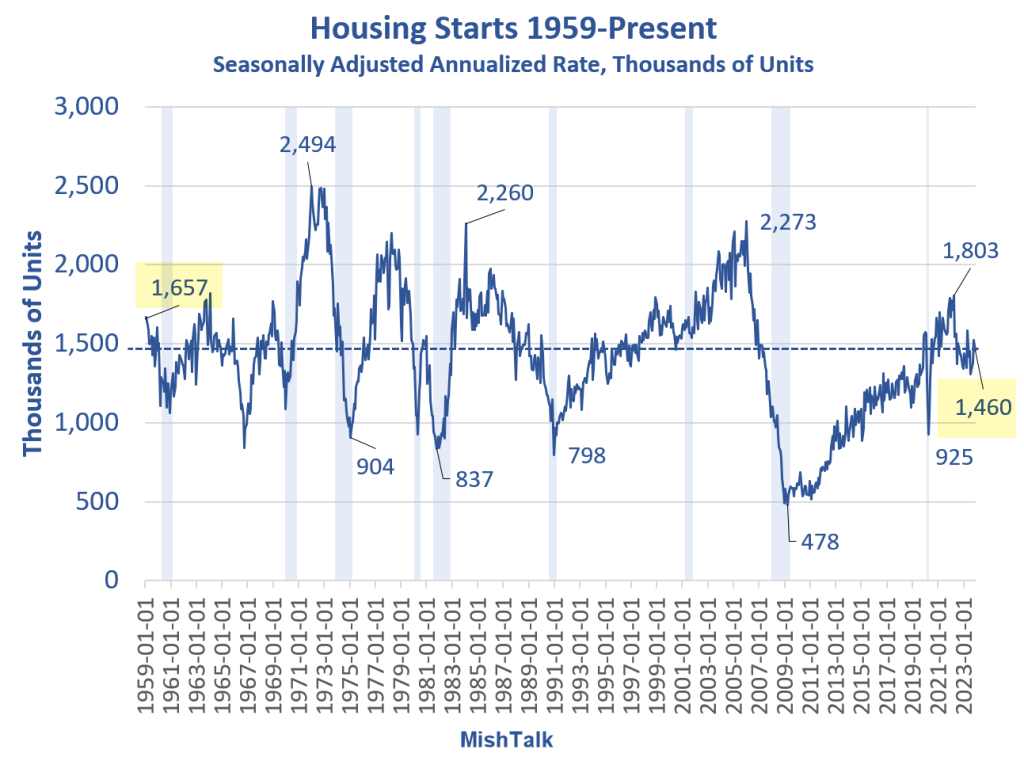
Housing Starts 1959-Present
(Click on image to enlarge)

Housing starts are well below where they were in 1959.
The average since 1959 is 1,284. So starts are 13.7 percent above average but 11.9 percent below January 1959. Hooray!?
We are nearly smack in the middle of immense swings.
Housing Starts Single Family vs Multi-Family
(Click on image to enlarge)

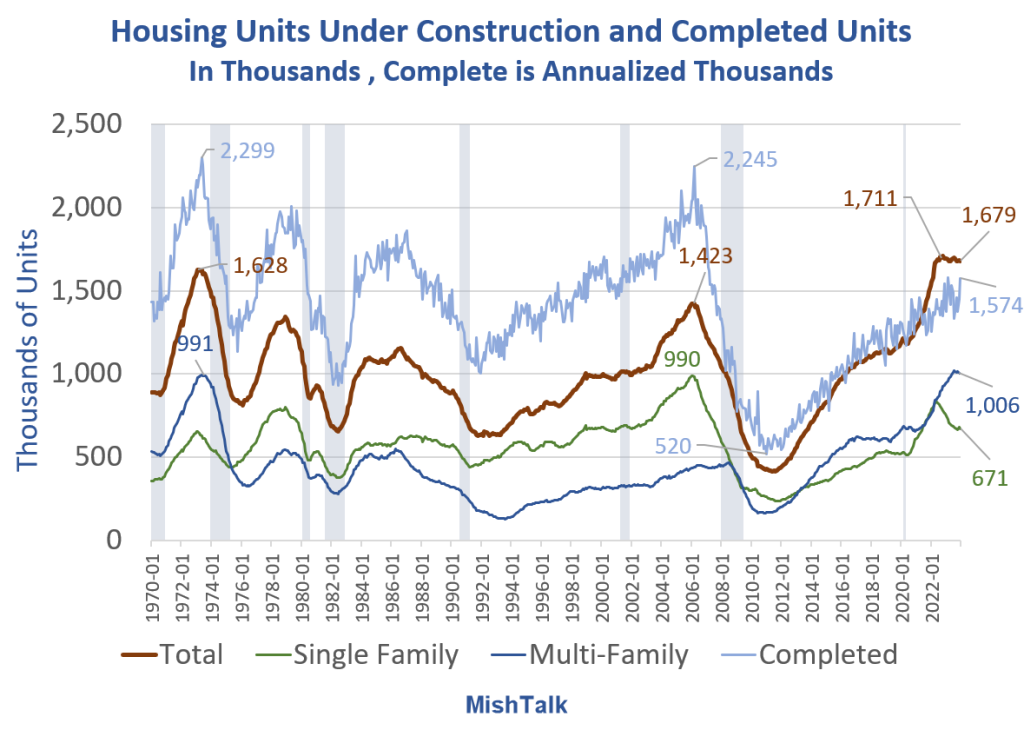
Housing Units Under Construction and Completed Units
(Click on image to enlarge)

We are near the record number of units under construction.
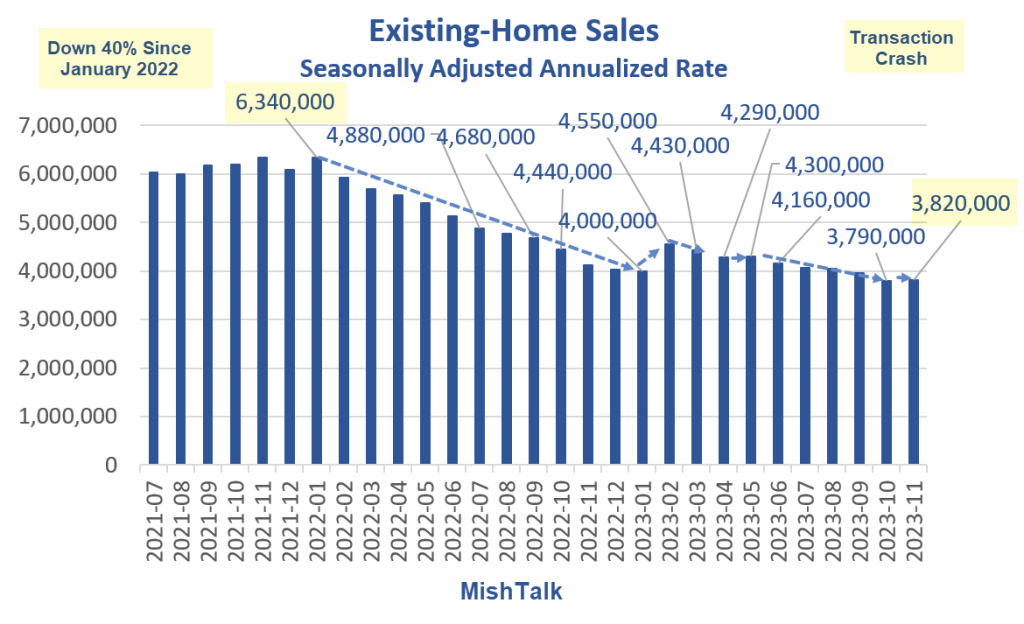
Existing Home Sales Rise 0.8 Percent, Only the Third Increase in 22 Months
(Click on image to enlarge)

Existing-home sales courtesy of the National Association of Realtors via the St. Louis Fed
For comparison purposes Existing Home Sales Rise 0.8 Percent, Only the Third Increase in 22 Months
Existing home sales rose in November. The National Association of Realtors chief economist, Lawrence Yun, eyes a “marked turn”.
Mortgage rates are down from a peak of 7.9 percent to 6.89 percent. This may entice some buyers, but for how long?
I see no basis for a “marked turn”.
More By This Author:
Bitcoin Technical Support And Resistance Levels, It’s Middle Of Nowhere NowHow Much Will That GOP Deal On Child Tax Credits Really Cost?
Retail Sales Surge 0.6 Percent, Beating Economist’s Expectations
Disclaimer: The content on Mish's Global Economic Trend Analysis site is provided as general information only and should not be taken as investment advice. All site content, including ...
more


