
Hold On To Cash And Be Ready To Trade The Downside
On Monday, August 13, 2018, SPX was down -11.35 points to close at 2821.93; the Dow was down -125.44 points to close at 25,187.70; and the Nasdaq slid -19.5 points to close at 7819.71. The US markets held up much better than the Asian markets, where Hong Kong and Shanghai led the slide.
Seemingly, the US markets are immune to global problems "outside" of the US. The recent trade war(s) have done much damage to the Asian stock markets. On Monday, a currency crisis in Turkey initially had US market futures down. But, before the markets opened, things had climbed back to about even. US markets traded mostly in the positive territory before giving in to the selling pressure. Still, the US markets closed Monday "seemingly" unscathed. AMZN even made a new all-time high of $1925 per share, desperate to join AAPL in the "T-Club" ("T" for trillion-$ market cap).
But, a closer look at the charts may show otherwise:
SPX
(Click on image to enlarge)
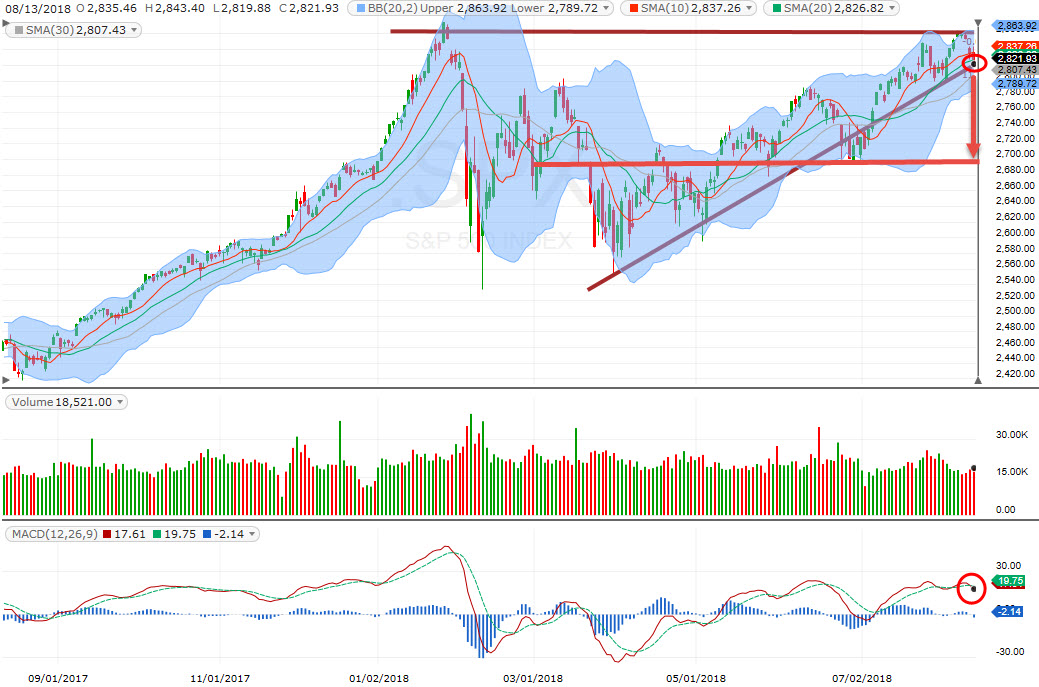
SPX has been unstable recently and seeing selling pressure above 2860. These past couples of sessions, selling pressure has been increasing, although so far, not substantial. On Monday, SPX closed just below the support and MACD has turned bearish. A quick fall could lead it to test 2700 within weeks.
RUT
(Click on image to enlarge)
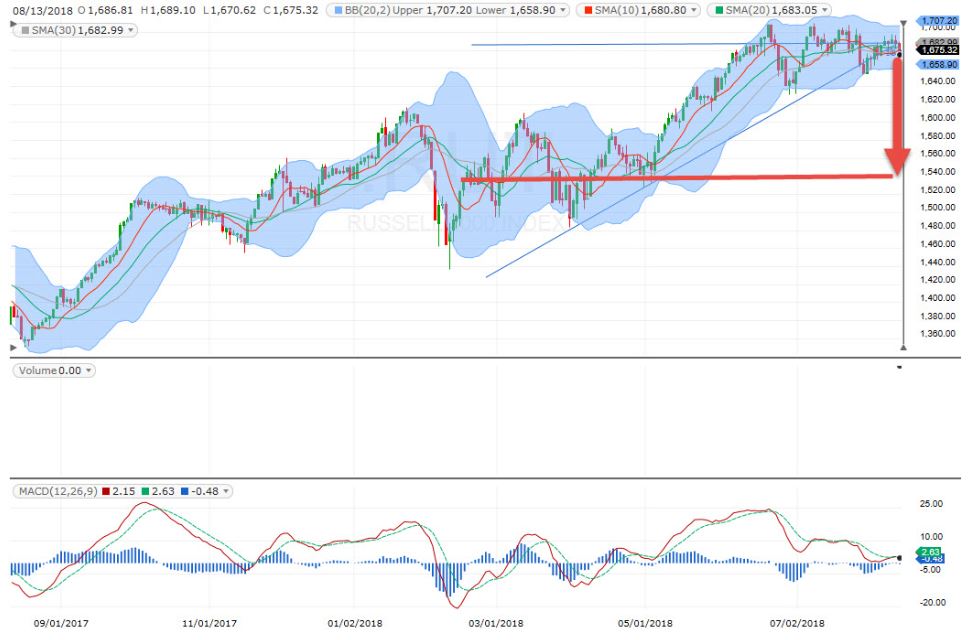
Russell 2000 has been consolidating at the top. The daily MAs have bunched up. On Monday, it also closed below the support. Is it also showing the potential for a big fall?
Personally, I'm finding it harder and harder to trade the long side at these levels. Recent strong earnings in tech stocks have boosted quite a few stocks, but, many of those stocks have also begun to see profit-taking (for example, LRCX, KLAC, GOOG). Earnings pop have been good trades though, for instance, KLAC was an easier one to call because LRCX had good earnings and positive reaction. I caught a nice trade on KLAC earnings trade for an overnight gain of +243%!

KLAC has since then pulled back and has been consolidating. Chinese stocks are again stumbling on Tuesday, but Japan's Nikkei is finding a bounce. Things are definitely volatile and the signals are unclear.
Therefore, it seems that people are locking in profits and perhaps staying on the sideline.
If the markets do fall over the cliff, the blue-chip stocks and big techs will need to show weakness. BA has been escalating since October 2016, and could be a good candidate for a downside play:
BA
(Click on image to enlarge)
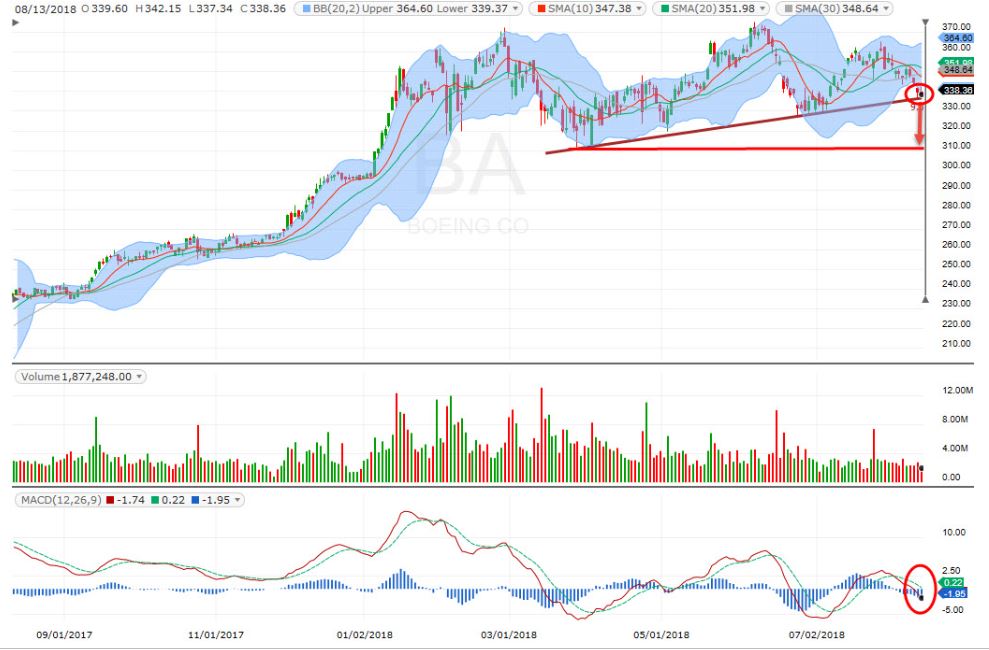
BA is right at support and could test the 310 level if the markets go into a substantial pullback.
BA Weekly Chart
(Click on image to enlarge)
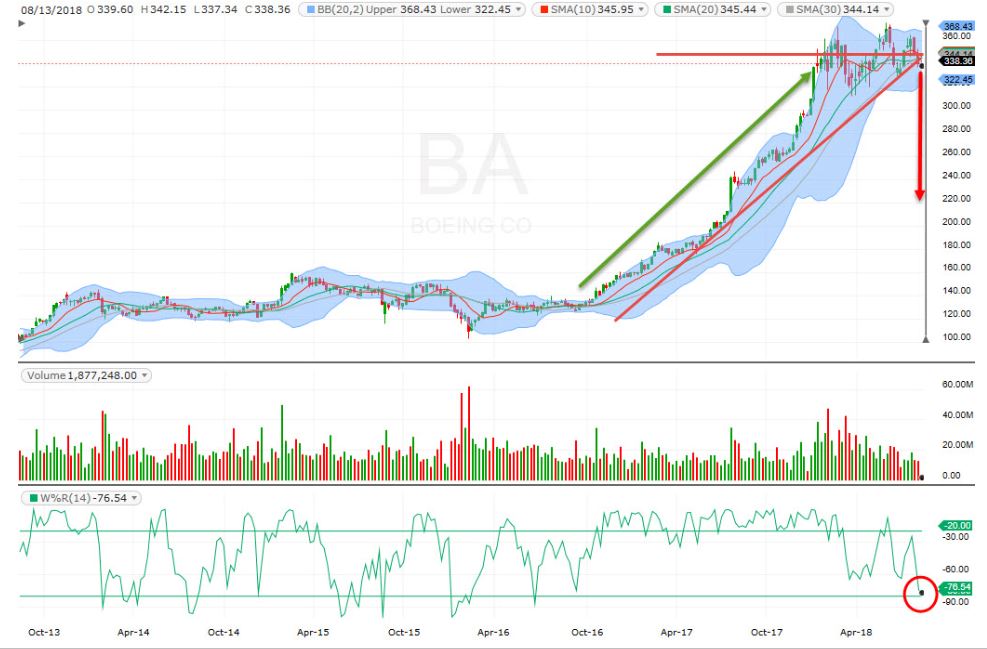
Its weekly chart also confirms a potential downside, with W%R showing weakness.
The markets are becoming more volatile. If we see another 10-point-plus slide on SPX at the open, I think the bears will come growling in. Be ready.
Disclosure: Please remember that past performance may not be indicative of future results. Different types of investments involve varying degrees of risk, and there can be no ...
more


Good stuff, have anything more recent?