
Higher Volatility Was Inevitable, But Bulls Still Control Their Own Destiny
After an inspiring final day of Q1 led by the usual “window dressing” of mutual fund managers, news-driven volatility returned with a vengeance on Monday before recovering some ground on Tuesday. Although I rarely trust market moves on the last day of a quarter or the first day of a new quarter, there is little doubt that market volatility is back this year, as I expected it would be. Last year, rather than enduring scary selloffs to correct imbalances, the market simply rotated into neglected market segments from time to time. This conviction to stay invested was largely due to consistent improvement in global economic fundamentals coupled with rising optimism about new fiscal stimulus – leading to a fear of missing out. But given the passage of the tax bill and plenty of progress with deregulation last year, I expected investors this year to display more of a Missourian “show me” attitude as to what Corporate America actually would do with their newfound cash windfalls and looser regulatory noose. Would this truly spell the end of the capex recession, ushering in a new wave of onshoring, PP&E upgrades, hiring, buybacks, and M&A? For their part, sell-side analysts have been raising corporate earnings estimates at a historically fast pace.
But the proof is in the pudding, as they say, and the price run-up and elevated valuation multiples (that arose in anticipation of tax cuts and new corporate investment) were due for compression, as speculation gives way to reality, along with some “price rationalization” and deleveraging of speculative portfolios. And on top of those dynamics, the market is suddenly fretting about tariffs, trade wars, inflationary pressures, and the Fed. Nevertheless, there seems to be something for all investors to hold on to, as both fundamentalists and technicians alike should be excited by the lower valuations and successful tests of support in a climate of robust growth and corporate earnings. But I’m not talking about a return to market conditions of old, characterized by falling interest rates, slow growth, and low volatility, which rewarded passive investing in cap-weighted indexes with elevated P/E’s. Instead, we likely are entering a new era, characterized by rising interest rates, faster growth, and higher volatility, which rewards sound stock-picking.
In this periodic update, I provide a market commentary, offer my technical analysis of the S&P 500, review Sabrient’s latest fundamentals-based SectorCast rankings of the ten US business sectors, and serve up some actionable ETF trading ideas. In summary, our sector rankings still look bullish, while the sector rotation model has fallen into a neutral posture during this period of consolidation and testing of support levels. Read on...
Market Commentary:
Investors seem to be focusing more on the threats than the opportunities right now. Besides P/E compression, price rationalization, deleveraging, and a fledgling rotation away from the dominant Momentum factor, investors are trying to assess the likely impact of the myriad news headlines, such as the President’s actions to address unfair trade agreements with tariffs meant to cajole some accommodation from our global trade partners. In addition, some of the mega-cap Tech stocks (e.g., FAANG) that have led the market for so long are seeing their business practices under attack, especially Amazon.com (AMZN ) and Facebook (FB). Also, we have a huge $1.3 trillion federal omnibus budget (despite full employment and solid GDP growth that would normally suggest a budget surplus) that some claim will bankrupt the nation. To be sure, there is nothing desirable about a budget deficit of $1 trillion and a national debt of $22 trillion (21% of GDP). And then there is the fear among some observers that new Federal Reserve chairman Jerome Powell is more concerned with normalizing short-term rates than he is about supporting the economy (the proverbial “Fed put”). Not to be outdone, Barron’s opined that corporate earnings growth expectations are so exuberant that there is likely more downside risk than upside potential as the earnings reports come in. Meanwhile, some market commentators are pointing to the strengthening technical condition of gold and bonds to say that stocks are in for more pain ahead. And lenders appear to be tightening their credit standards and lending less, suggesting all is not well on Main Street.
In other words, there are plenty of negative narratives flying around, and for the moment they are giving rise to the dreaded climate (previously witnessed in the 2H2015-1H2016 timeframe) of news-driven risk-on/risk-off trading, rising correlations, higher volatility, and reduced strategic equity exposures.
However, all is not lost. On the contrary, there is no denying the underlying strength in the global economy and the continuously improving outlook for US corporate earnings. In fact, it’s hard to fully predict all the various impacts (both direct and indirect) we will see from tax reform and deregulation over the next few years. 1Q2018 earnings reports are on tap in just a matter of days, and with the tailwind of massive tax cuts (corporate tax rates falling from 35% to 21%), consensus S&P 500 earnings are expected to grow +17% year-over-year versus 1Q2017 (up from expected Q1 growth of +11% at the beginning of the year and the best year-over-year performance since 1Q2011) – and many well-selected stocks should do quite a bit better. Moreover, economists generally expect GDP growth to come in somewhere in the 2.5-3.0% range, compared with 1.2% in 1Q2017. Inflation fears have tempered, bonds have caught a bid, and extreme equity valuations have fallen as technical support levels have been tested. And don’t forget, spring is in the air, which is a seasonally strong time for stocks, and Morgan Stanley estimates that about $400 billion in global dividends will be paid out this quarter, adding further buying fuel.
President Trump’s newly-imposed tariffs and his venting about Amazon’s fleecing of the taxpayer by minimizing its taxable income and by leveraging a government-subsidized US Post Office – not to mention its ability to steamroll both large corporate competitors and Mom-and-Pop shops alike – have certainly spooked the markets. After all, tariffs may spark a global trade war, right? And Amazon represents the future of commerce as it shakes up the world through “creative disruption” to the long-term benefit of us all, right? Well, perhaps, but to me these are simply the latest examples of Trump’s negotiating style, as he tries to stand up for the little guy without actually derailing growth in both the economy and the stock market that he so covets. Rather than watch trade negotiations languish in committee for years on end with no resolution, he skips the diplomacy and instills a sense of urgency with the stroke of a pen and some tough language. Likewise, rather than quietly cajole Jeff Bezos to pay higher shipping rates, he tries to humiliate him into submission. Remember his tough talk to Russia and North Korea about his willingness to engage in a nuclear arms race that we would “easily win”? Sounds a lot like his tariff talk today.
We know that Canada and Mexico have already gotten reprieves, given that they have shown good faith in renegotiating NAFTA. Then, the EU was also excluded, and the announcement came that countries could apply for relief from the new duties. Of note, the Mexican peso has been the strongest performing currency in the world so far this year. In any case, we are too deeply in debt to engage in a full-blown trade war, with $22 trillion in total federal debt and a newly jacked-up budget deficit to boot. In fact, the whole world is too indebted for it. After initially announcing a small retaliatory response, South Korea agreed to revise its 6-year-old bilateral trade deal, and China is opting for a conciliatory approach, as well, despite the mild retaliatory moves the press is hyping. After all, the US has a $375 billion trade deficit with China, which puts us in the stronger position.
China cannot afford any impediments to its aggressive growth targets. It is already on a path to liberalizing foreign investment – by necessity. Given that its rapidly growing status as an economic power is eroding its ability to continue to leverage low labor costs in a (largely subsidized) manufacturing economy and dump cheap goods on the rest of the world, China knows that it must encourage consumption from its growing middle class and allow more foreign capital to flow into the country. Chinese bonds soon will be added to the Bloomberg Barclays Global Aggregate Index, which is widely followed by fund managers, and JPMorgan is considering adding Chinese bonds to its Government Bond Index. This will attract passive flows (e.g., ETFs) of global capital into China’s bond market – estimated by Goldman Sachs to perhaps exceed $250 billion. Furthermore, MSCI is adding mainland-China stocks to its emerging markets index, which could result in $500 billion in passive flows. So, as its current account surplus falls, its capital and financial account deficits will also fall, offsetting the impact.
A rotation out of the narrow list of mega-cap Tech and into a broader group of market segments (including other big-Tech names outside of the FAANG gang) seems to be unfolding. I think this is healthy broadening behavior, and I think the actual impact on these companies’ bottom lines is being way overblown such that they will find interested buyers soon enough. But Jim Paulsen, the chief investment strategist at Leuthold Group, tracks the ratio of Technology versus Utilities stocks, which is rolling over in a pattern that he thinks resembles the dot-com crash, as momentum darlings are suddenly shunned. But let’s make sure we are comparing apples to apples here. Valuations, cash flows, and cash balances today are so much healthier than they were 20 years ago, and there has been no artificial demand for technology upgrades today as was seen in advance of the Y2K scare.
State Street Global Advisors reports that aggregate US-listed ETFs saw consecutive monthly outflows for the first time since 2008, although Q1 overall (with a big January of inflows) still saw the “second-best start to a year ever.” During Monday’s selloff, the S&P 500 retested its intraday peak (1/26/2018) to trough (2/9/2018) drawdown of -11.7%, although the recovery this time around didn’t quite recover the 200-day simple moving average. S&P Dow Jones Indices reported that the Dow Jones Industrial Average broke a string of nine straight positive quarters with a loss of -2.49% during 1Q2018. Also, the quarter witnessed a continuation of the factor performance themes of 2017, with Growth and Momentum factors dominating at the expense of Value, Quality, and Low-volatility, while rising short-term rates lessened the appeal of dividend payers. However, they noted signs of a reversal late in the quarter, and the Momentum factor’s risk profile is most concentrated “toward large-cap, high beta, and technology stocks,” leaving it vulnerable to “higher drawdown risk compared to other strategies.” Furthermore, the firm reported an interesting observation that small-cap Healthcare was up an impressive +13% during Q1. No other market segments were even close, with mid-cap Healthcare (+6%), mid-cap Tech (+4%) as distant runners-up.
Despite the worrisome market action, nothing has changed in the fundamental picture of synchronized global economic expansion, impressive US economic reports, strong US corporate cash flow, and earnings, as well as high cash balances. Unemployment remains near 1960 lows. Inflation is modest. Interest rates remain low. Deregulation has freed up the resources of companies, which is especially helpful to small- and mid-caps. And of course, the biggest tax overhaul in a generation is just starting to gain traction – incentivizing capital investment, expansion, onshoring of offshore operations, and hiring, as well as higher dividends, continued share buybacks, and additional M&A. They might even pay down some debt.
Let’s talk about the latest economic reports. Weekly jobless claims fell to a 45-year low. The Conference Board’s LEI is strong and rising. Housing and mortgage reports are solid. Retail and wholesale inventories rose nicely. Consumer Confidence and Investor Confidence remain quite strong, with a broad-based demand for equities among global institutional investors. The BEA’s third estimate of real GDP in 4Q17 was increased to 2.9%, reflecting “a downturn in private inventory investment that was partly offset by accelerations in PCE, exports, state and local government spending, nonresidential fixed investment, and federal government spending, and an upturn in residential fixed investment.” For 1Q18, the Atlanta Fed’s GDPNow model was just updated Monday morning with a higher forecast of 2.8% (due to higher expected consumer spending and private fixed investment), while the New York Fed’s Nowcast model projects 2.7% for 1Q18 and 2.9% for 2Q18.
After the quarter-point rate hike in March, the current target fed funds rate is 1.50-1.75%, and the Fed "dot plot" still projects two more rate hikes this year, which would bring the target rate to a 2.00-2.25% range by year-end. CME fed funds futures currently place the odds of rate hike #2 coming at the June meeting at 81%, and by September there is a 53% chance of the third rate hike. By the December meeting, there is a 73% chance of a third hike, 30% probability of a fourth quarter-point rate hike, and a small 4.3% chance of a fifth hike – but also a significant 27% chance that the fed funds rate will remain at 1.75%-2.00% (i.e., only two rate hikes this year). After briefly spiking on inflation fears before finding resistance at the 3.0% level, the 10-year Treasury continues to catch a bid. It closed Tuesday at 2.78%, while the 2-year closed at 2.28%. The closely-watched 2-10 spread continues to flatten and is now at 50 bps – well under the 100 bps “normalcy threshold,” causing many Fed-watchers to worry that the new Fed chair Jerome Powell is more concerned with normalizing short-term rates than he is about supporting the economy with the “Fed Put.” But I think Powell is just trying to exude confidence in the economy, and he certainly will act as necessary to prevent the yield curve from inverting or the economy from falling into recession.
DataTrek has pointed out that the markets seem to be watching the breakeven rate between Treasury yields and Treasury inflation-protected securities (TIPS) of the same term, and the differential for both 5-year and 10-year terms currently implies future inflation right around the Fed’s 2% target rate. In other words, no runaway inflation.
After last year’s talk about a “new normal” of lower volatility, the market is now coming to terms with the notion that elevated volatility is here to stay – at least this year given the uncertainties of tariffs and mid-term elections. DataTrek observed that the S&P 500 registered 23 daily returns of +/- 1% (or more) during Q1, compared to only 8 during all of last year. The CBOE Market Volatility Index (VIX ), aka “fear gauge,” closed Q1 at 19.97 – right at the “panic threshold” of 20, and this elevated volatility has led to elevated sector correlations and some risk-on/risk-off behavior. VIX closed Monday at 23.62 (after spiking above 25), but then closed rebound Tuesday at 21.10.
All things considered, I see equity valuations as being quite attractive right now. The forward next-12-months (NTM) P/E on the S&P 500 is around 16.5x, so flipping it upside down equates to an earnings yield of 6.0%. Compared to the 10-year Treasury yield of 2.78%, that’s an equity risk/inflation premium of about 3.2%. And with robust EPS growth firmly in the pipeline, I expect the S&P 500 to see a double-digit return by year-end, even as share price growth falls back in better alignment with earnings growth (where it belongs). Let’s throw around some numbers. If the forward P/E at the end of 2018 is 17.5x (6% higher than the current forward P/E but still lower than the 18.5x at the beginning of the year, reflecting the multiple compression I have expected for this year) and earnings are projected to grow by 10% in 2019, then the S&P 500 would finish the year roughly 16% higher than it is now – or around 3,030 – which would indicate a price return for 2018 of around 13% and a total return (including dividends) of nearly 15%. If instead the forward P/E compresses to 17x by year-end, that would imply a price return of about 10% and total return of nearly 12%.
And I am not alone. JPMorgan’s U.S. equity strategist Dubravko Lakos-Bujas just reiterated his year-end 3,000 target for the S&P 500, opining last week that the selling has been largely technical, trend-following, and/or options hedging (in response to all the negative news headlines), “and as such represents a buying opportunity for fundamental investors” and that “strong macro and fundamentals will continue to prevail.”
Of course, 12-15% total return for the year on the S&P 500 is not bad at all. But I think a well-selected portfolio of attractive “growth at a reasonable price” (GARP) stocks has the potential to perform even better. This is what Sabrient seeks to do with our various GARP portfolios, including our monthly all-cap Baker’s Dozen. (Note: We also publish other GARP-oriented portfolios focused on market segments like small caps, dividend income, stocks for a rising interest-rate environment, and defensive equity.) In particular, I still see small caps as a good bet, especially given that they stand to benefit the most from lower tax rates, deregulation, and M&A activity. Moreover, I think this year will see a heightened focus on fundamentally sound companies across all caps, as well as the Value and Quality factors, targeting market segments with attractive GARP characteristics that cannot be ignored any longer.
Let me finish my commentary today with a simple plea. I think the key to diminishing our country’s extreme political polarity and restoring unity and cooperation can be found in one simple exhortation. It is actually Habit 5 of Stephen Covey’s 7 Habits of Highly Effective People: “Seek first to understand, then to be understood.” It sounds so simple, so logical, so easy. But it is not, particularly in such a toxic political climate. Rather than dismissing the other side as either cruel or naïve, unfeeling or unthinking, strident or hypocritical, instead, seek to truly understand the full nature and backdrop of the other viewpoint. Then and only then, should you articulate your own. Notably, the old Roseanne TV comedy show has returned with the same cast and huge ratings right out of the gate…plus at least one stated objective of fostering a political climate of mutual respect for conflicting viewpoints. This is so different from the prevalent approach of cable news and social media of fomenting discord in order to boost ratings. Understanding and compromise have become dirty words in today’s all-or-nothing politics. But it doesn’t have to be so.
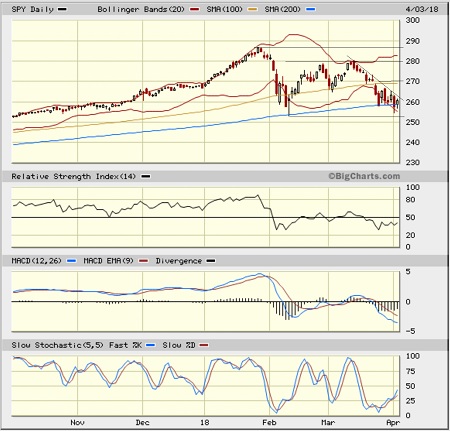
SPY Chart Review:
The SPDR S&P 500 ETF (SPY ) closed 1Q2018 at 263.15 and then started Q2 with a thud on Monday before recovering some ground on Tuesday, closing at 260.73. However, I don’t like to give too much credence to technical behavior on the first or last day of the quarter, given the manipulation and “window dressing” commonly implemented by mutual funds. SPY closed the quarter right its 200-day simple moving average (around 259) and then lost support on Monday. But there was no confirmation of that lost support on Tuesday, as bulls returned to push up price just enough. Of concern, SPY has already made a “lower high” versus its January high, and now the start of Q2 has given us the first “lower low” that may be confirming an imminent downtrend. After successfully testing support at its 200-day simple moving average (SMA) in February and then stair-stepping its way back up, it found resistance at 280 and turned back down in ominous fashion, potentially in the process of forming a bearish descending triangle. A confirmed breakdown below the 200-day SMA would be undesirable, but a confirmed breakdown below double-bottom support at 253 would be quite bearish and suggest the beginning of a bigger correction. However, keep in mind that descending triangles sometimes turn out to be quite bullish, fueled by both dip buying and short covering. A confirmed breakout above the upper downtrend line would be quite bullish, taking price up to fill the gap at 270, at a minimum. Oscillators RSI, MACD, and Slow Stochastic all are pointing up from oversold territory and look poised to cycle further upwards.
Latest Sector Rankings:
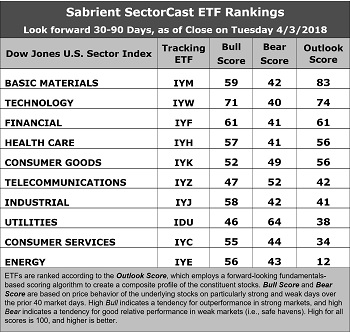
Relative sector rankings are based on our proprietary SectorCast model, which builds a composite profile of each of over 600 equity ETFs based on bottom-up aggregate scoring of the constituent stocks. The Outlook Score employs a forward-looking, fundamentals-based multifactor algorithm considering forward valuation, historical and projected earnings growth, the dynamics of Wall Street analysts’ consensus earnings estimates and recent revisions (up or down), quality and sustainability of reported earnings, and various return ratios. It helps us predict relative performance over the next 1-3 months.
In addition, SectorCast computes a Bull Score and Bear Score for each ETF based on recent price behavior of the constituent stocks on, particularly strong and weak market days. A high Bull score indicates that stocks within the ETF recently have tended toward relative outperformance when the market is strong, while a high Bear score indicates that stocks within the ETF have tended to hold up relatively well (i.e., safe havens) when the market is weak.
Outlook score is forward-looking while Bull and Bear are backward-looking. As a group, these three scores can be helpful for positioning a portfolio for a given set of anticipated market conditions. Of course, each ETF holds a unique portfolio of stocks and position weights, so the sectors represented will score differently depending upon which set of ETFs is used. We use the iShares that represent the ten major U.S. business sectors: Financial (IYF), Technology (IYW), Industrial (IYJ), Healthcare (IYH), Consumer Goods (IYK), Consumer Services (IYC), Energy (IYE), Basic Materials (IYM), Telecommunications (IYZ ), and Utilities (IDU). Whereas the Select Sector SPDRs only contain stocks from the S&P 500 large-cap index, I prefer the iShares for their larger universe and broader diversity.
Here are some of my observations on this week’s scores:
1. Basic Materials retains the top spot in the rankings with a strong Outlook score of 83. The sector continues to see solid sell-side analyst sentiment (net positive revisions to EPS estimates), a low forward P/E (15.2x, after a steep selloff related to tariff worries), good insider sentiment (net open market buying), and the highest return ratios. The forward PEG (ratio of forward P/E to forward EPS growth rate) is a favorable 1.25. Technology again takes the second spot with an Outlook score of 74, as it boasts the best sell-side analyst sentiment, the second highest projected year-over-year EPS growth rate (15.9%), a low forward PEG of 1.05, and strong return ratios. Financial comes in a distant third at 61, with a low forward P/E of 15.2x and a forward PEG of 1.11. Rounding out the top five are Healthcare and Consumer Goods (Staples/Noncyclical), all having Outlook scores above 50. Not surprisingly, most of the forward PEG ratios are much more attractive after the selloff, with the lowest (best) forward PEG going to Energy (0.53) and the highest (worst) going to Utilities (3.14).
2. Energy continues to sit at the bottom of the Outlook rankings with a score of 12 despite its strong projected year-over-year EPS growth rate of 36.9% and low forward PEG. Telecom has risen noticeably out of the bottom two, replaced by Consumer Services (Discretionary/Cyclical) with a score of 34.
3. Looking at the Bull scores, Technology enjoys the top score of 71, as stocks within this sector have displayed relative strength on strong market days, while Utilities scores the lowest at 46. The top-bottom spread is 25 points, which reflects low sector correlations on strong market days. It is desirable in a healthy market to see low correlations reflected in a top-bottom spread of at least 20 points, which indicates that investors have clear preferences in the market segments and stocks they want to hold (rather than broad risk-on behavior).
4. Looking at the Bear scores, we find Utilities at the top with a score of 64, which means that stocks within this defensive sector have been the preferred safe havens lately on weak market days. Technology has the lowest score of 40, as investors have fled during recent market weakness. The top-bottom spread is 24 points, which reflects low sector correlations on weak market days. Ideally, certain sectors will hold up relatively well while others are selling off (rather than broad risk-off behavior), so it is desirable in a healthy market to see low correlations reflected in a top-bottom spread of at least 20 points.
5. Technology displays the best all-around combination of Outlook/Bull/Bear scores, followed closely by Materials, while Energy is the worst. Looking at just the Bull/Bear combination, Technology is still the best, followed closely by Utilities, indicating superior relative performance (on average) in extreme market conditions (whether bullish or bearish), while Healthcare scores the worst, as investors have generally avoided the sector lately. However, Consumer Goods (Staples/Noncyclical) seems to display the best balance between Bull and Bear scores, or the best all-round appeal.
6. This week’s fundamentals-based Outlook rankings continue to reflect a bullish bias, given that the top four sectors are economically-sensitive, and all four score above 50. Keep in mind, the Outlook Rank does not include timing, momentum, or relative strength factors, but rather reflects the consensus fundamental expectations at a given point in time for individual stocks, aggregated by sector.
ETF Trading Ideas:
Our Sector Rotation model, which appropriately weights Outlook, Bull, and Bear scores in accordance with the overall market’s prevailing trend (bullish, neutral, or defensive), displays a neutral bias and suggests holding Basic Materials (IYM), Technology (IYW), and Financial (IYF), in that order. (Note: In this model, we consider the bias to be neutral from a rules-based trend-following standpoint when SPY is between its 50-day and 200-day simple moving averages.)
Besides iShares’ IYM, IYW, and IYF, other highly-ranked ETFs in our SectorCast model (which scores nearly 650 US-listed equity ETFs) from the Basic Materials, Technology, and Financial sectors include PowerShares DWA Basic Materials Momentum (PYZ), PowerShares Dynamic Semiconductors (PSI), and First Trust NASDAQ Bank ETF (FTXO).
If you prefer a bullish bias, the Sector Rotation model suggests holding Technology, Basic Materials, and Financial, in that order. On the other hand, if you are more comfortable with a defensive stance on the market, the model suggests holding traditionally defensive sectors Utilities, Telecom, and Consumer Goods (Staples/Noncyclical), in that order.
An assortment of other interesting ETFs that are scoring well in our latest rankings include Alpha Architect US Quantitative Value (QVAL), First Trust Materials AlphaDEX (FXZ), SPDR S&P Regional Banking (KRE), Direxion All Cap Insider Sentiment (KNOW, which licenses and tracks a Sabrient index), Pacer US Cash Cows 100 (COWZ), iShares US Home Construction (ITB), John Hancock Multifactor Materials (JHMA), SPDR MFS Systematic Value Equity (SYV), and Elkhorn Lunt Low-Vol High-Beta Tactical (LVHB).
Disclaimer: This newsletter is published solely for informational purposes and is not to be construed as advice or a recommendation to specific individuals. Individuals should take into account ...
more

