
Here They Go Again - Subprime Delinquencies Rising On The Dealer Lots
Yesterday’s WSJ article on rising auto loan delinquencies had a familiar ring. It focused on sub-prime borrowers who were missing payments within a few months of the vehicle purchase. Needless to say, that’s exactly the manner in which early signs of the subprime mortgage crisis appeared in late 2006 and early 2007.
More than 8.4% of borrowers with weak credit scores who took out loans in the first quarter of 2014 had missed payments by November, according to the Moody’s analysis of Equifax credit-reporting data. That was the highest level since 2008, when early delinquencies for subprime borrowers rose above 9%.
To be sure, subprime auto will never have the sweeping impact that came from the mortgage crisis. The entire auto loan market is less than $1 trillion compared to a mortgage market of more than $10 trillion at the time of the crisis.
Yet the salient point is the same.The apparent macro-economic recovery and prosperity of 2004-2008 rested on an illusion of unsustainable debt fueled housing boom; this time its the auto sector.
Indeed, delete the auto sector from the phony 5% GDP SAAR of Q3 2014 and you get an economy inching forward on its own capitalist hind legs. Q3 real GDP less motor vehicles was up just 2.3% from the prior year (LTM); and that’s the same LTM rate as recorded in Q3 2013, and slightly lower than the 2.4% growth rate posted in Q3 2012.
Aside from autos, there has been no acceleration, no escape velocity. Furthermore, the 2%+/- growth in the 94% balance of the economy after the 2008-09 plunge has nothing to do with the Fed’s maniacal money printing stimulus and the booster shot from cheap credit that is supposed to provide.
The reason is straight forward. There is no such thing as Keynesian monetary magic. Central bank interest rate repression either encourages households to supplement income based spending with incremental borrowings— or it has no direct impact on measured GDP.
The fact is, outside of autos and student loans, households have reached peak debt. That is after a 30-year spree of getting deeper and deeper into hock, middle class households stopped adding to leverage on their wage and salary incomes at the time of the financial crisis; and since then they have actually deleveraged slightly—albeit at levels that are still way off the historical charts.
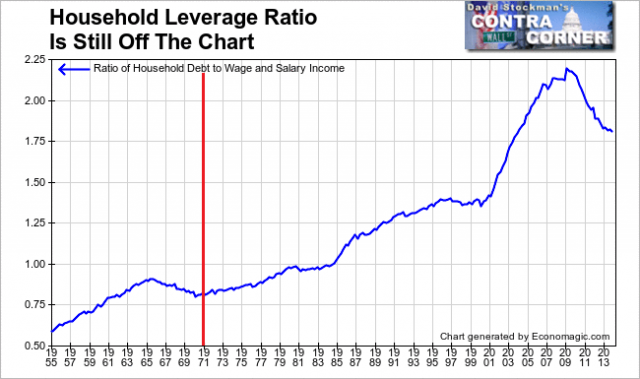
Household Leverage Ratio
But underneath this aggregate—which includes all forms of household debt including mortgages, credits cards, auto and student loans etc.—- there has been a sharp bifurcation of trend since the pre-crisis peak in 2007.
Home mortgage debt is down by $1.1 trillion or 9% from its late 2007 peak in absolute terms, and even more dramatically as a ratio against income.

US Mortgage Debt data by YCharts
Likewise, household credit card and revolving debt—after decades of rising in absolute terms and as a ratio to income—is also down significantly. Stated differently, after 73 months of ZIRP, households have not responded to the Fed’s parlor trick. Not withstanding aggressive marketing by credit card companies, credit-worthy households have exercised restraint, while the fast majority of mainstream households which leave hand to mouth have remained too credit-impaired to borrow.

US Credit Card Debt data by YCharts
By contrast, auto debt outstanding has fully recovered and soared to record levels. And the reason is not hard to find.
Car loans are collateralized and recoverable by the repo man when borrowers fail to pay. But unlike the case of housing, there has not yet been a crash in the value of new and used vehicles. So lenders—and especially the big banks like Chase and Well Fargo—-have had a field day making auto loans and either funding them with essentially zero cost deposits or selling them at an instant “gain-on-sale” profit to the securitized paper market.
Consequently, auto loans outstanding are up nearly 30% from the post-crisis bottom, and nearly 20% from their prior peak. In short, the near total recovery of auto sales rests on a trillion dollar mountain of debt.

US Auto Loan Debt data by YCharts
Here’s the thing. On the margin, much of the recent growth of auto sales has been attributable to sub-prime borrowers, which are now up to 25% of all loans. These loans carry onerous interest rates—often 20% or more—-and are available primarily due to junk debt financing of non-bank lenders. That is, fly-by-night start-ups organized by Wall Street and private equity funds.
Eventually, the soaring default rates described in the attached WSJ article will infect the entire auto market—-just as did the implosion of sub-prime mortgages last time around. When the volume of defaults and repossessions gets high enough, the used car market will falter, and the food chain of auto sales will fail.
And that means that the Fed’s sole success in stimulating uneconomic lending will come ricocheting right back into the recorded GDP. Stated differently, the V-shaped recovery in auto sales is undoubtedly the last hurrah for the Fed’s maniacal embracing of ruinous printing press economics.

US Vehicle Sales data by YCharts
more

Comments
 No Thumbs up yet!

