

Thanks loyal readers and those as well who may be reading for the first time. Glad to have you with us. We wish you a happy upcoming Independence Day this week. This short poem by Julia Ann Moore, entitled Fourth of July, sums it up so well:
Fourth of July, how sweet it sounds,
As every year it rolls around.
It brings active joy to boy and man
This glorious day throughout our land.
Of course, it was written long ago, so we want to make sure that we extend our heartfelt wishes for everyone, including girls and women to enjoy the holiday and more importantly, that we all remain grateful for the independence we enjoy in this country and to never take it for granted!
Speaking of independence. This past week while doing some research to assist me in writing this column, I thought long and hard about what independence means to me and my family. Besides the freedom for us to do what we want and be who we want, also what came to mind was the freedom to learn and practice how to invest more effectively and with better results.
We have many subscribers who go way back in time that have been using investment tools and investment models that MarketGauge has been offering. You may not be aware of the fact that MarketGauge was started over 25 years ago and was one of the first successful investment services offered on the internet.
As my grandfather used to say to me “An overnight sensation only takes about 15 years”. So, you could say after all this time MarketGauge is an overnight sensation.
One of the long-term users of MarketGauge investment products was visiting our offices in Santa Fe the past few days. He mentioned to Keith and Geoff how much the MarketGauge tools have helped him become a better trader and that he feels that he has developed the “freedom” to enjoy trading now that he is in retirement from his successful high level corporate career. He claims that he is having more fun being able to successfully navigate the markets now and to handsomely profit from our tools. Are you doing the same? Drop us a line and let us know what is working and what you might need more assistance with.
Let’s jump right in to the first half of 2024.
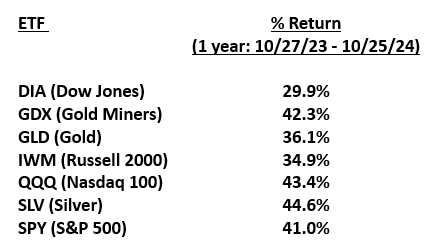
Before we discuss the upcoming month of July, let’s take a quick look at how the different market indices have performed so far in 2024. I think most economists, Wall Street analysts and many market prognosticators would admit they are very surprised at the performance for the last month (June) and year-to-date 2024 so far. First, let me summarize the first 6 months of 2024 and then provide a table showing the actual performance.
- Markets have been resilient in the face of higher interest rates and a sub-par bond market.
- After spiking earlier in the year, commodity prices have been retreating, suggesting that lower inflation and possibly deflation is coming.
- Most of the inflation indicators are trending down giving credence that the Federal Reserve will likely cut their overnight lending rate sometime in the next 6 months. This is supporting many company’s high P/E multiples.
- Volatility in the markets has remained low. In fact, there have been no unusual spikes which would accompany a significant correction.
- It has been approximately a year since we experienced a 2% or greater one day decline in the S&P 500.
- We keep making new all-time highs (ATH) in the S&P 500, many more than expected by most Wall Street analysts.
- Most of Wall Street was surprised that the earnings for the S&P 500 for Q1 (reported the past 3 months) were well above expectations. 79% of S&P 500 companies beat their earnings estimates with 61% also beating their top line revenue estimates.
- The unfolding AI revolution is not only increasing expectations for future revenue and earnings, but getting investors excited at the prospect of a huge tidal wave of expanding technologies which support these lofty stock prices and high multiples.
- The economy has stayed strong and is currently softening enough for most analysts to still believe we could avoid a recession and have a “soft landing”.
Most of the above bullet points have helped lift the stock market (S&P 500 & NASDAQ 100) to a positive and surprising first half return. See the table below:

I am surprised by these returns. Given the higher interest rates and Fed’s effort to slow the economy down, mid-teen returns are pleasant surprises. However, it is important to note that the two indices (SPY & QQQ) are heavily influenced by a few of the biggest stocks and given the meteoric rise of Nvidia and continued move up of the top 5% of the S&P 500 cap weighted index, it may not be a shocker. The good numbers for the S&P and the NASDAQ are illustrated in the graph below:

So far this year, it has been all about the mega-cap stocks that have driven most of the returns of the S&P 500 and the QQQ. I wrote extensively about the concentration effect of the mega cap stocks in the past two issues of Market Outlook.
Use the links below to review them:
“Can The Bull Market Keep on Kicking? Or Is It Growing Tired? The Answer May Surprise You!”
“Celebrating the All-Stars Winners!”
Please notice the table above showing the equal weight S&P 500 (RSP), the Dow Jones (DIA) and the Small and Midcap indices that have had surprisingly low returns so far this year. This reflects the more equal weighted narrative that many stocks are not yet participating in this rally. For small and mid-cap stocks this also reflects the cost of borrowing, which remains high.
While small-cap stocks (Russell 2000 index - IWM) have gone nowhere this year, they are trying to break above the 210 magical number that might signal they have “broken out” and begin a healthy move up. Most analysts covering these smaller companies believe this will happen as soon as the Fed cuts rates. See graph below:

The Negative Analysts
Before we get into the current positive stock market bias and historical July pattern, it is important to point out that there are plenty of market analysts and pundits who remain negative and continue to cite “their proof” that the markets are setting up for a significant correction or meltdown.
One such pundit, Peter Berezin, Chief Global Strategist at BCA Research, said in a report this past Thursday delivered courtesy of MarketWatch, that he has revised down his target for the S&P 500 to 3750, lower than JP Morgan Global Research’s year-end target of 4200, the previous Wall Street projected low, due to expectations that the U.S. will soon enter a sudden and unexpected recession. Berezin expects the recession to begin later this year or early 2025.
According to his forecast, if this prediction comes true, the S&P 500 could decline more than 30% from Friday’s levels.
Berezin (and JP Morgan’s research) is rooted in the notion that a slowdown in labor markets is poised to accelerate rapidly, which will put enormous pressure on consumer spending, which currently accounts for about 71% of GDP and is a key economic driver.
According to Berezin, there are clear signs that consumer spending has already been slowing in recently released economic data, including Friday’s personal consumption expenditures price index for May (PCE). Berezin believes this could be only the beginning, as a suddenly enfeebled labor market may kick off a vicious cycle.
Also, he points out that data on bank balances already show that lower-income Americans appear to have depleted their pandemic era savings. As these delinquency rates for credit cards and auto loans, which are already at levels unseen since 2010, continue to climb, banks could opt to raise their lending standards, adding to pressures facing the consumer. See personal savings rate chart below, which may or may not support this narrative:
Personal savings rate. "The saving rate edged up in May, but it's still well below the pre-pandemic norm. Positive spin: Americans aren't feeling the need to pull back spending. Neg. spin: Americans are barely able to make ends meet."

This also may be showing up in Companies beginning to lighten up on capital expenditures (non AI related we might add), which is showing up in declining spending on commodities. This is where the slowdown and possible deflationary narrative begins to take hold. See chart below:

Another negative sign we uncovered during our research that we thought you should be aware of and could have negative consequences later this year, is the current credit spread market. See illustration below:
Credit spreads. "The spread between the weakest and strongest investment-grade credits bottomed nearly two months ago. Credit concerns are rising even as stocks hit record highs. This is unusual and was last seen in late 2021."

We are not necessarily in full alignment with Mr. Berezin’s thesis above or the credit spread worries (yet). We have been hearing about the dreaded recession for two years now due to the inverted yield curve. We addressed this in last week’s column as well.
However, we do believe that the advent of better technology, mostly through the build out of AI, may alleviate high demand on the current tight skilled labor market and allow companies to be more productive with less workers. We suspect that this may partly feed into Mr. Berezin’s thesis.
Climbing the Wall of Worry.
As we have all come to learn over the years, the markets climb a wall of worry. Sometimes, the more negative these pundits become, the more the market climbs this wall. I suppose these negative prognosticators help to take some of the froth out of the markets by motivating their followers and investors to move money to cash which then eventually will be redeployed to play “catch up” when the same investors realize they are “missing out”.
Please note that we have been suggesting to you since January to stay invested as our algorithms (and common sense) have been guiding investors that it has been “safe” to be invested in various markets. As we will show you in a few minutes, many of the indicators, along with our BIG VIEW Color Charts, are suggesting we should get more fully invested. As you will see, this is supported by current positive momentum indicators and the July narrative we will share with you
While his and other’s negative bear market predictions are yet half a year away, we strongly suggest that you stay glued to our BIG VIEW charts (especially the color charts) and the RISK GAUGES and utilize PROFIT NAVIGATOR if you want an easy way to invest in the SPY with a high win-loss ratio and stellar historical numbers, this strategy (can be utilized unleveraged or highly leveraged and with/without bonds) is the perfect strategy to utilize and not worry about these potential negative actions.
The July bullish narrative.
As evidenced above and through the countless negative weekly investment publications I receive, there are a lot of negative writers, analysts and prognosticators (it helps that a negative bias helps sell newsletters). Many of them will spend so much time and space expanding on why the markets are way over priced and why we are set-up to have a severe correction imminently.
Historically July is NOT THE TIME this happens.
Two of the common talking points of these negative pundits is “breadth is lousy” and “the markets are being driven by just a few stocks and this “over concentration, much like 1999-2001 is going to wreak havoc”. We want to dispel these ideas right now.
Breadth and over concentration at the current time are actually right at the average. See chart below:
Performance breadth. "The current 8% share of S&P 500 index constituents returning 30% or more through June is roughly in line with the 10% historical average since 1990, implying 2024 is fairly typical of past years."

We provide another chart showing that the negative short-term breadth we have been experiencing recently may help us to reach new future all-time highs. As you can see in Exhibit 16 below, the current bad breadth can be construed as a positive given what occurs one year later. See chart below:
Breadth mean reversion. "History suggests weak breadth itself isn’t a precursor of market weakness: in years of mega-cap leadership since 1986, the market was up the subsequent year nearly 75% of the time."


Money Managers have been increasing their exposure to S&P futures. I believe that this coincides with the fact that the S&P continues to hit new ATHs. As you recall from above, the S&P 500 was up over 3% for the month of June while many analysts (and stock trading programs) were suggesting investors reduce exposure to the markets and move some risk capital to cash, our Profit Navigator stayed invested.
One important constituent that was not negative was the money managers who control a significant amount of risk-on capital. See illustration below:
Asset manager positioning. "Asset managers have increased their net long position on E-mini SPX futures, which we believe confirms the rally on the SPX from its April low ... Positioning is back to the July 2021 net long peak level but there is some room to run to the peak positioning level of early 2020"

Here comes July…the best month of the year.
I bet that statement may surprise you. But consider this, July is the beginning of the second half of the year. It begins the 2nd Quarter earnings season. Since the market is typically looking out for 4-6 months of potential business, July begins to factor in the 4th quarter which has historically been the strongest quarter of the year for businesses. And this is all amplified during an election year.
We begin this narrative by showing that stocks don’t peak in June. This has not happened for the past 74 years. This is probably due in part to July’s good historical performance. See chart below (many thanks to Ryan Detrick of The Carson Group who produces the following charts):

July is a very strong month for stocks and we are encouraged that many of the technical signs have been improving over the last two weeks. Here is the chart showing the S&P 500 over the past 10 years:

July is the best month of the year over the past 20 years. See chart below:

We hope that this provides plenty of ammunition for you to stay the course and possibly remain bullish. Again, please review the BIG VIEW Risk Gauges with some frequency. Become familiar with the Color Charts and also review them frequently.
If you are not yet a user/subscriber to Profit Navigator, consider becoming one. It may keep you on the right side of the market more often.
Have an enjoyable, relaxing and festive Fourth of July holiday. Stay grateful for the independence and privileges we all enjoy.
We will turn it over to Keith and his team who put together the BIG VIEW BULLETS.
Make sure to notice two important recurring themes in the bullets and the Big View charts you can follow on your own:
- Market rotation from tech to cyclically sensitive stocks
- Improving trends in market breadth that support the ideas discussed above.
Thanks for reading.
More By This Author:
Will The Winning Trend Continue?Can The Bull Market Keep on Kicking? Or Is It Growing Tired? The Answer May Surprise You!
Celebrating the All-Stars Winners!

Comments
Log in or sign up to join the conversation.