Good Riddance, Janet, You Were A Colossal Failure
This is one for the record books. During Janet Yellen's last week in office, the Dow dropped by 1,095 points or 4.1%. But by her lights, apparently, that wasn't even a warning bell--- just the market clearing its collective throat.
So on the way out the door, our Keynesian schoolmarm could not resist delivering what will soon be seen as a grand self-indictment. There's nothing to worry about, she averred, because Wall Street's OK and main street is positively awesome:
I don't want to label what we're seeing as a bubble....(even if) asset valuations are generally elevated....(but) when I see the unemployment rate fall to 4.1%...I feel very good about the progress we've seen there.
No, there is a monumental bubble out there that was born, bred and nurtured at the hands of the Fed. At the same time, Yellen and her merry band of money printers had virtually nothing to do with the 4.1% unemployment rate---even if that were a valid measure of return to full employment prosperity, which it is not.
To the contrary, the main street economy is sick as a dog, and it is the Fed's giant Wall Street bubbles which made it so. That said, hereupon follows the ringing economic and financial indictment that Janet Yellen so richly deserves.
In the first place, that Fed's dangerous digression into massive QE and 100 months of near-ZIRP had virtually nothing to do with the limpid "recovery" that has transpired since the June 2009 bottom. And we do mean its contribution amounted to nothing---- as in zero, zip and zilch.
That's because the Fed does not levitate the main street economy through some kind of magical mystery monetary potion. It's one and only tool is fostering household and business credit growth, which, in turn, gets applied to enhanced spending for consumer and capital goods beyond what is supportable from current income.
If the Fed's maneuvers in the money and capital markets do not end up in higher household leverage and a debt-financed spend-a-thon, for example, then no "stimulus" happened in the consumer sector. Consequently, the Eccles Building cannot validly claim credit for goosing the growth rate of household consumption spending (70% of GDP) and for its contribution to overall economic performance.
In general, our thesis is that central bank stimulus of household spending is equivalent to a one trick pony. Once all the latent headroom on household balance sheets and income statements to raise leverage levels is used up, cheap debt loses its efficacy in the main street economy.
In fact, that is exactly what has happened. During the first 20-years of the Greenspan-incepted era of Bubble Finance, household leverage ratios exploded. Whereas wage and salary incomes rose by $4.2 trillion or 2.9X, household liabilities soared by nearly $12 trillion or 5.2X.
Over the two decades, therefore, household leverage ratios (liabilities to earned income) nearly doubled from 124% to 224%.
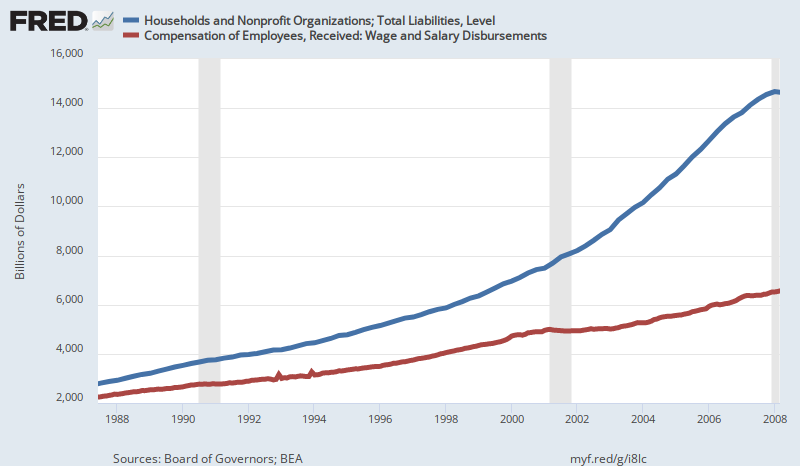
Not surprisingly, this eruption of household leverage enabled much of main street America to live beyond their means. Thus, during the 20 years from Greenspan's arrival at the Fed to the credit bubble peak in Q4 2007, wage and salary disbursements grew at just 5.3% per annum (green line). Nevertheless, household consumption spending rose significantly faster at nearly 6.0% per annum (red line).
The gap was closed by borrowing, of course, which grew at the blistering pace of 8.5% per annum (blue line) or nearly 60% faster than earnings. Thus, the Fed's cheap interest policy did "stimulate" household spending on a one-time basis.
So doing, however, it also buried them in an explosion of mortgage debt---including massive equity cash-outs---as well as credit card and auto loans.

Needless to say, the Great Financial Crisis (GFC) was in large part a warning that the one-trick pony had played itself out in the consumer sector.
Accordingly, there was zero credit stimulus to household spending after the financial crisis---notwithstanding the Fed's massive QE program and more than 100 months of ZIRP. During the nine years after household credit peaked in July 2008, in fact, household liabilities grew by just 0.6% per annum in nominal dollars, while nominal wage and salary income rebounded at a 2.8% annual rate.
Consequently, the household leverage level dropped sharply from what we have termed Peak Debt at 224% of wage and salary income in mid-2008 to just 185% by Q3 2017. In effect, the household sector of the main street economy actually deleveraged modestly during the so-called post-crisis recovery.
To be sure, household leverage still towers way above its pre-1980 level (< 100% of wages and salaries) and would need to drop from the current vastly inflated level of $15.5 trillion to about $8.0 trillion in order to revert to its (healthy) historical norms.
But our point here is that whatever the Fed stimulated after Bernanke pulled out all the stop in September 2008, and which Yellen maintained at full throttle during her four years at the helm in the Eccles Building, it was not the huge household sector of the mainstreet economy. The modest peak-to-peak growth rate of nominal wage and salary incomes during the past nine years, which, in turn, was the entire source of the equally modest growth rate of household consumption during that period, was a product of the natural regenerative forces of market capitalism.
Janet Yellen didn't have a damn thing to do with it!

The point is that the rate of both income and consumption spending growth slowed sharply during the post-GFC "recovery" because there was no after-burner from rising leverage and credit expansion. Personal consumption expenditures, for example, grew at just 3.6 per annum or at just three-fifths of the nearly 6.0% rate of 1987-2007.
Indeed, on the face of it, the proposition that the Fed had anything to do with the consumer recovery is belied by the blue line below, which represents household credit outstanding. Compared to the 8.5% rate of growth during 1987-2007, household credit expanded by just 0.8% per annum during the past nine years.
In short, there is no such thing as Fed monetary magic. If it is not operating through the credit channel of transmission to the household sector, it is not stimulating main street. Period.

And that latter proposition is all the more true when you examine private fixed investment, which includes both residential housing and business sector investment in plant, equipment and software/technology. These investment categories are purportedly sensitive to interest rates and the cost of debt, and therefore have been the second target of the Fed's cheap debt policies.
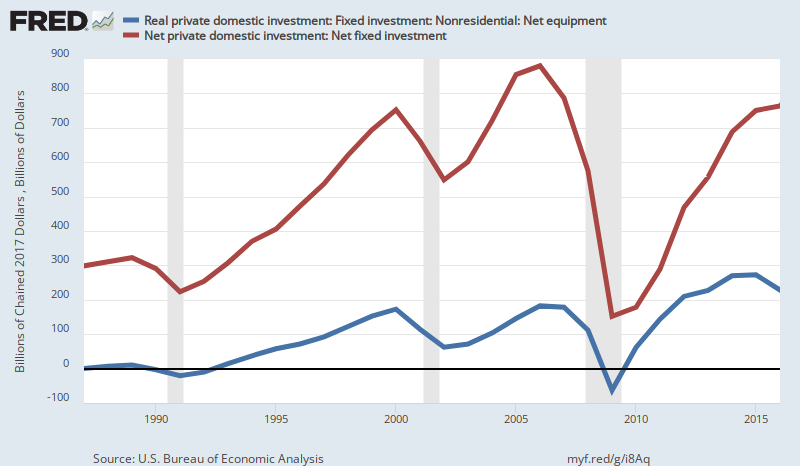
Generally, Fed stimulus in the fixed investment sector also worked effectively through the pre-crisis peak in 2007. Total real net fixed investment expanded at a 7.3% annual rate through the dot-com peak in 2000 and kept climbing until 2007, where it registered a 20-year gain of 5.5% per annum.
Moreover, it needs to be recalled here that we are dealing with inflation-adjusted numbers and also net changes in the capital stock. In combination, they are the sine qua non of true economic expansion and rising living standards.
In particular, "net investment" is a crucial factor because to the extent that reported gross investment outlays merely offset current period depreciation and other forms of capital consumption, that does not generate economic growth; it merely keeps the treadmill going. Actual economic expansion, therefore, requires investment in excess of the depreciation rate, and there was plenty of that during the first 20 years of the Bubble Finance experiment.
No longer. During the last nine years, real net fixed investment in the US economy (red line) has declined at a -3.2% annualized rate. Notwithstanding all of Janet's money pumping, therefore, the nation's real stock of productive capital assets has been shrinking.
The same story is evident in the sub-category measuring real net investment in business equipment, which represents the heart of productivity gains and tools per worker. After growing at a 13.6%annual rate during the two-decades ending in 2007, it has declined at a 1.3% annual rate since the pre-crisis peak.
It is not surprising, therefore, that productivity growth has been punk notwithstanding all the purported "stimulus" to capital investment. In fact, net real investment in equipment per worker declined from $1,610 in 2007 to $1,370 in 2016, representing a drop of 15%.
The question recurs, therefore, as to what happened to all the cheap debt that was available to the business sector, and which was, in fact, borrowed hand-over-fist by corporate and non-corporate business alike.
Thus, during the 20 years ending in the 2007 pre-crisis peak, corporate debt grew by 6.5% per year, but unlike in the case of real net investment, the corporate debt expansion rate has hardly slowed at all, posting at 6.2% per annum during 2007-2017. Since inflation was slightly lower during the latter period, real corporate debt growth has actually accelerated during the current recovery.

The obvious answer to the confluence of accelerating real debt growth and sharply decelerating real fixed investment trends is that the central bank fostered tsunami of business borrowings went not into productive assets, but corporate financial engineering. For instance, aside from a temporary peak in early 2007, stock buybacks and dividends by the S&P 500 averaged between $200 billion and $300 billion per year before 2010. Since then, they have been in the $400 billion to $600 billion per year zip code.
On top of that has come trillions more in M&A deals, LBOs, and leveraged recaps. Virtually none of this financial engineering activity adds to economic efficiency---despite all the corporate IR department ballyhoo about synergies and savings.
If those claims were even remotely true, the US economy would have become an engine of soaring productivity growth decades ago---when in fact productivity trends have been in a nose-dive for the last decade. During that period, by contrast, the total amount of corporate cash plowed back into Wall Street (M&A, buybacks, dividends, LBOs, and recaps)amounted to nearly $15 trillion. Overwhelmingly, it added to the bid for existing financial assets, especially equities and their derivatives, not the efficiency and growth capacity of the main street economy.

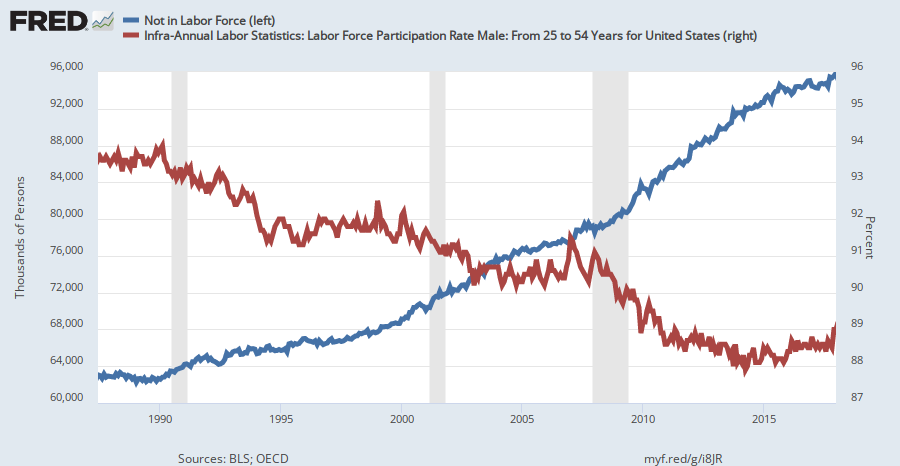
In part 2, we will address in detail Janet Yellen's risible claim that the 4.1% U-3 unemployment rate is a measure of economic success. But that can hardly be true in the face of the chart below. To wit, there are now 96 million (per below) adults not in the labor force and 102 million "not employed" counting the official "unemployed". That compares to only 50 million persons aged 65 years or higher.
Likewise, the labor force participation rate of prime-age males (25-54) has dropped sharply during the same period. As we will show in Part 2, a far better measure of "slack" labor is potential work hours of the adult population compared to actual hours worked. At upwards of 25% to 40% depending upon what is counted as employed, the latter unutilized labor resource measure amounts to a mockery of Janet Yellen's self-congratulations.
Even short of a detailed analysis of the labor force data, it is self-evident that Yellen is simply painting by the numbers---presuming that a minimum wage job clocking 10 hours per week ($4,000 per year in gross pay with minimum or zero benefits) is the same thing as an auto factory job paying $100,000annually with overtime and generous health and pension contributions on top.
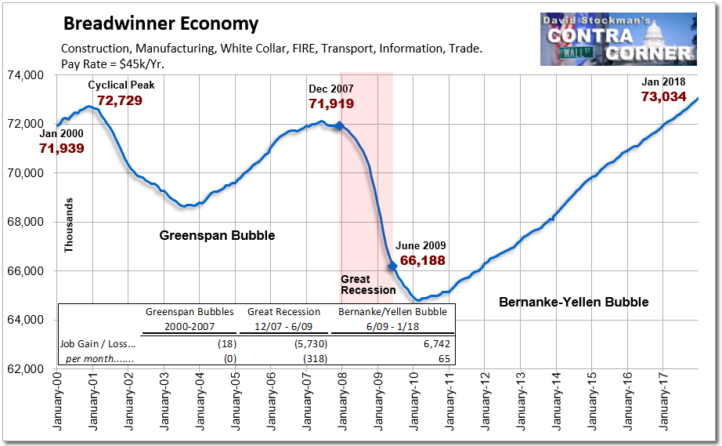
The obvious apples and oranges nature of the monthly jobs data is so transparent, in fact, that the constant recitation of it by Yellen has been proof all along that she is clueless about the condition of the actual main street economy. Apparently, she never noticed even once the chart below, which is a rough approximation of the growth trend of real full-time, full pay breadwinner jobs in the US.
In a word, after another "strong" January jobs report----the growth rate remains tantamount to none. That is, since January 2001, the stimulus saturated US economy has generated just 305k net breadwinner jobs. That about 1500 per month for the entirety of this century!