Goldman Hit Our Target And We See More Downside To Come
The Goldman Sachs Group, Inc. (GS) is an American multinational investment bank and financial services company headquartered in New York City.
Goldman Sachs Tower, Jersey City - Unsplash
It offers services in investment management, securities, asset management, prime brokerage, and securities underwriting.
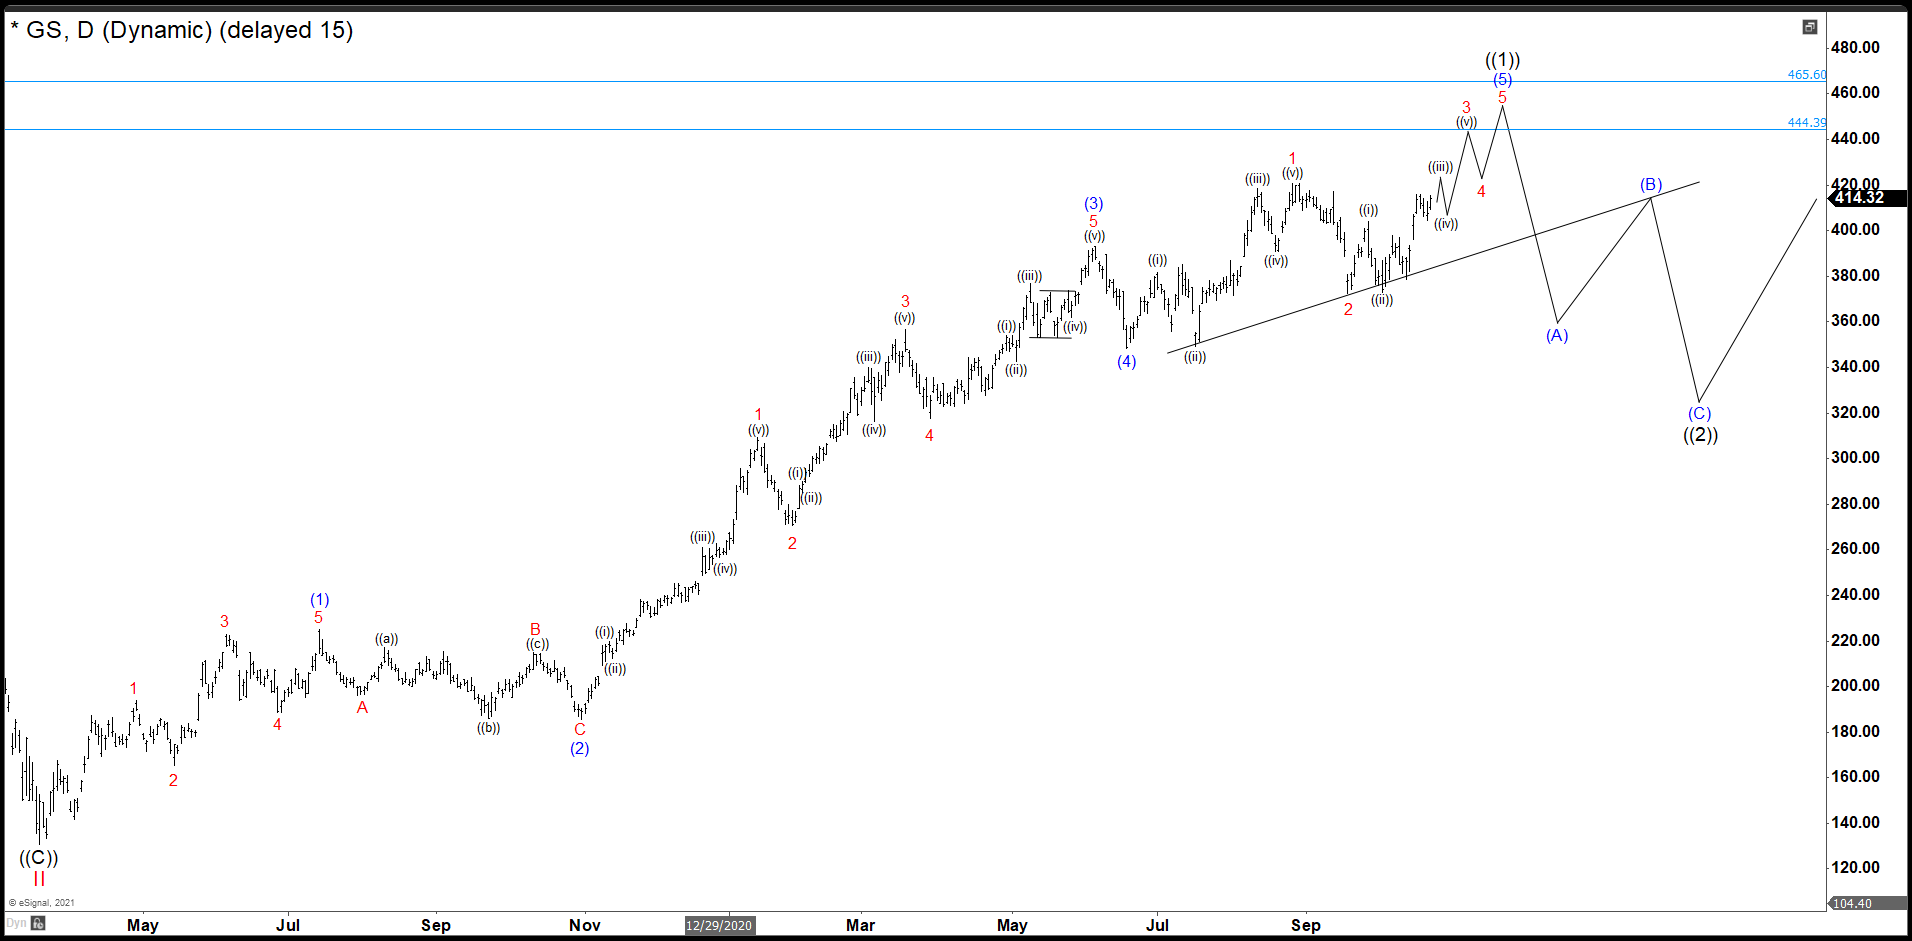
GS October 2021 Daily Chart
Last October, we were looking to complete an impulse from March 2020 low. The first wave of impulse that we called wave (1) ended at 225.24 dollars. Pullback as wave (2) ended at 185.52. Then the stock rally creating 5 swings up in lesser degree to form wave (3) completed at 393.26. Wave (4) correction finished at 348.13 and from here last rally ended at 426.16 without reaching our minimum target 444.39. GS drawn an ending diagonal structure to complete wave (5) and the impulse wave ((1)).
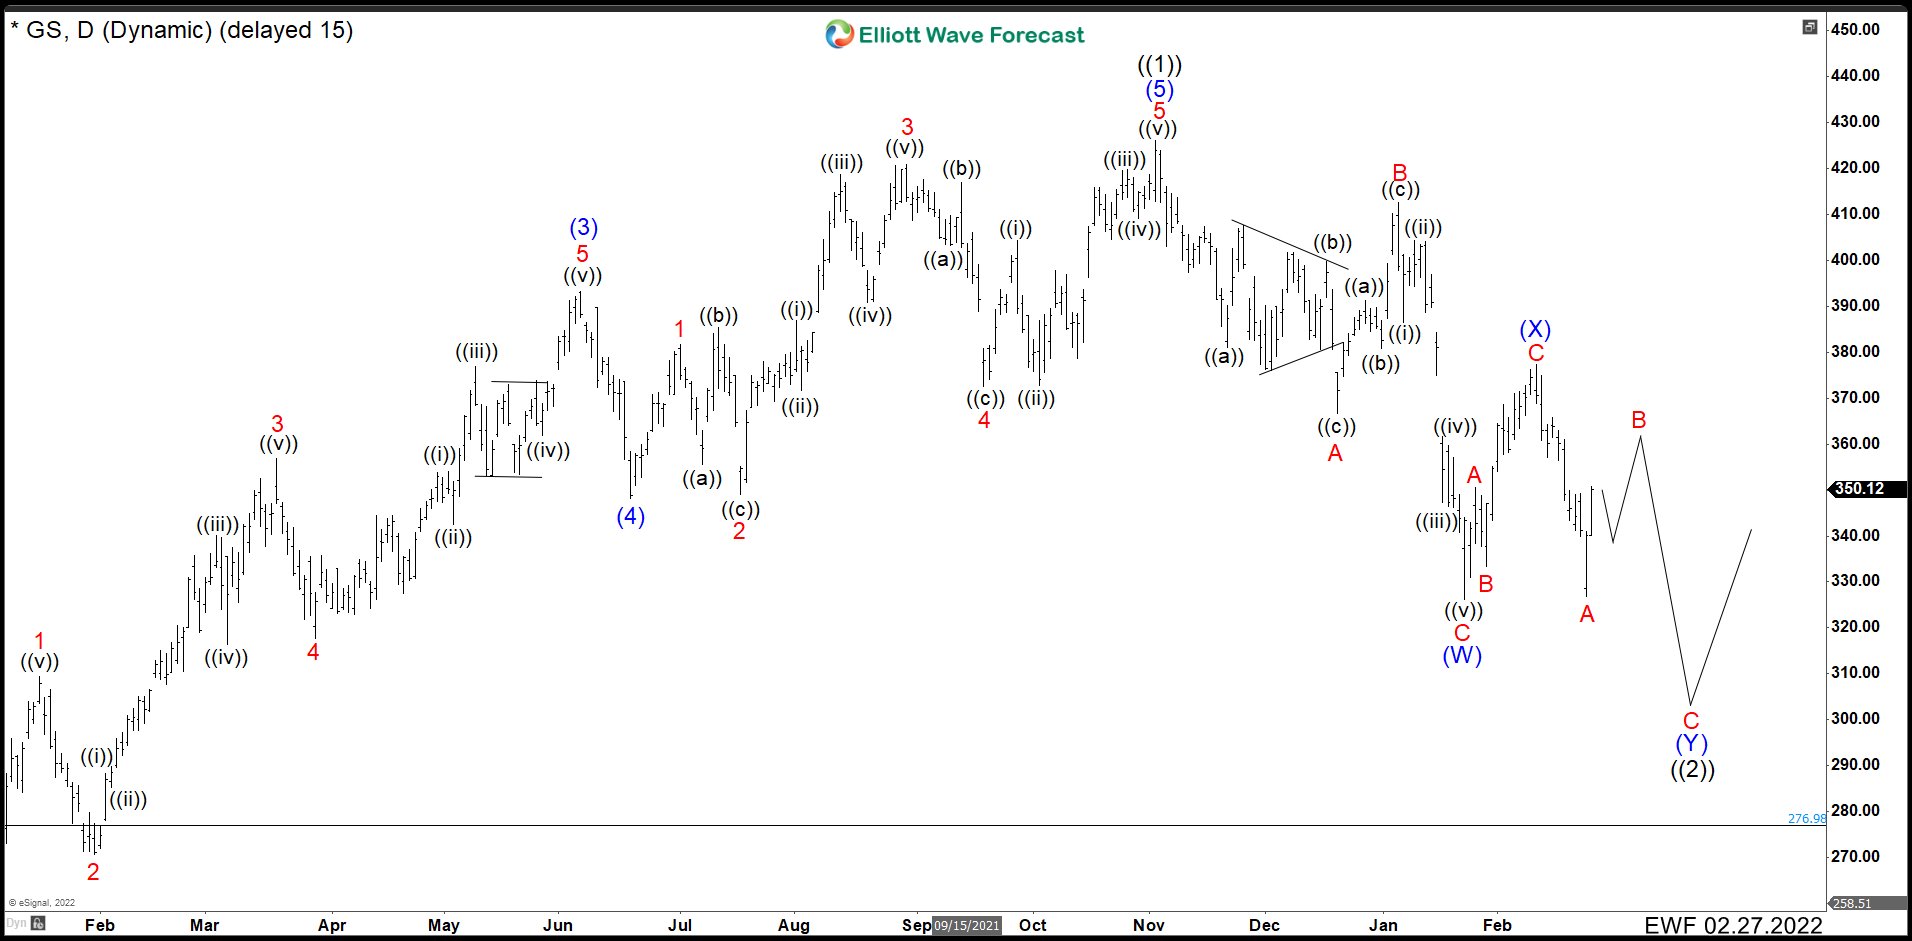
GS February Daily Chart
From the peak, GS fell in 3 swings to end wave A at 366.65. Then 3 swings up to complete wave B at 412.66 and an impulse dropped to finish a flat correction. As we have already drawn 3 swings correction, we can perfectly continue with the rally from here. However, given the market conditions we are calling a double correction. Therefore, we are labeling 326.23 low as (W), bounce to 377.40 as wave (X). This Elliott structure needs 3 swings down more, a simple ABC, to complete it. Wave A is done already at 326.95 and currently we are developing wave B and after ending this wave we should see further bearish movement. The target to complete this correction and wave ((2)) we are considering 305.00 – 277.00 area. The view is valid as we stay below 377.40.
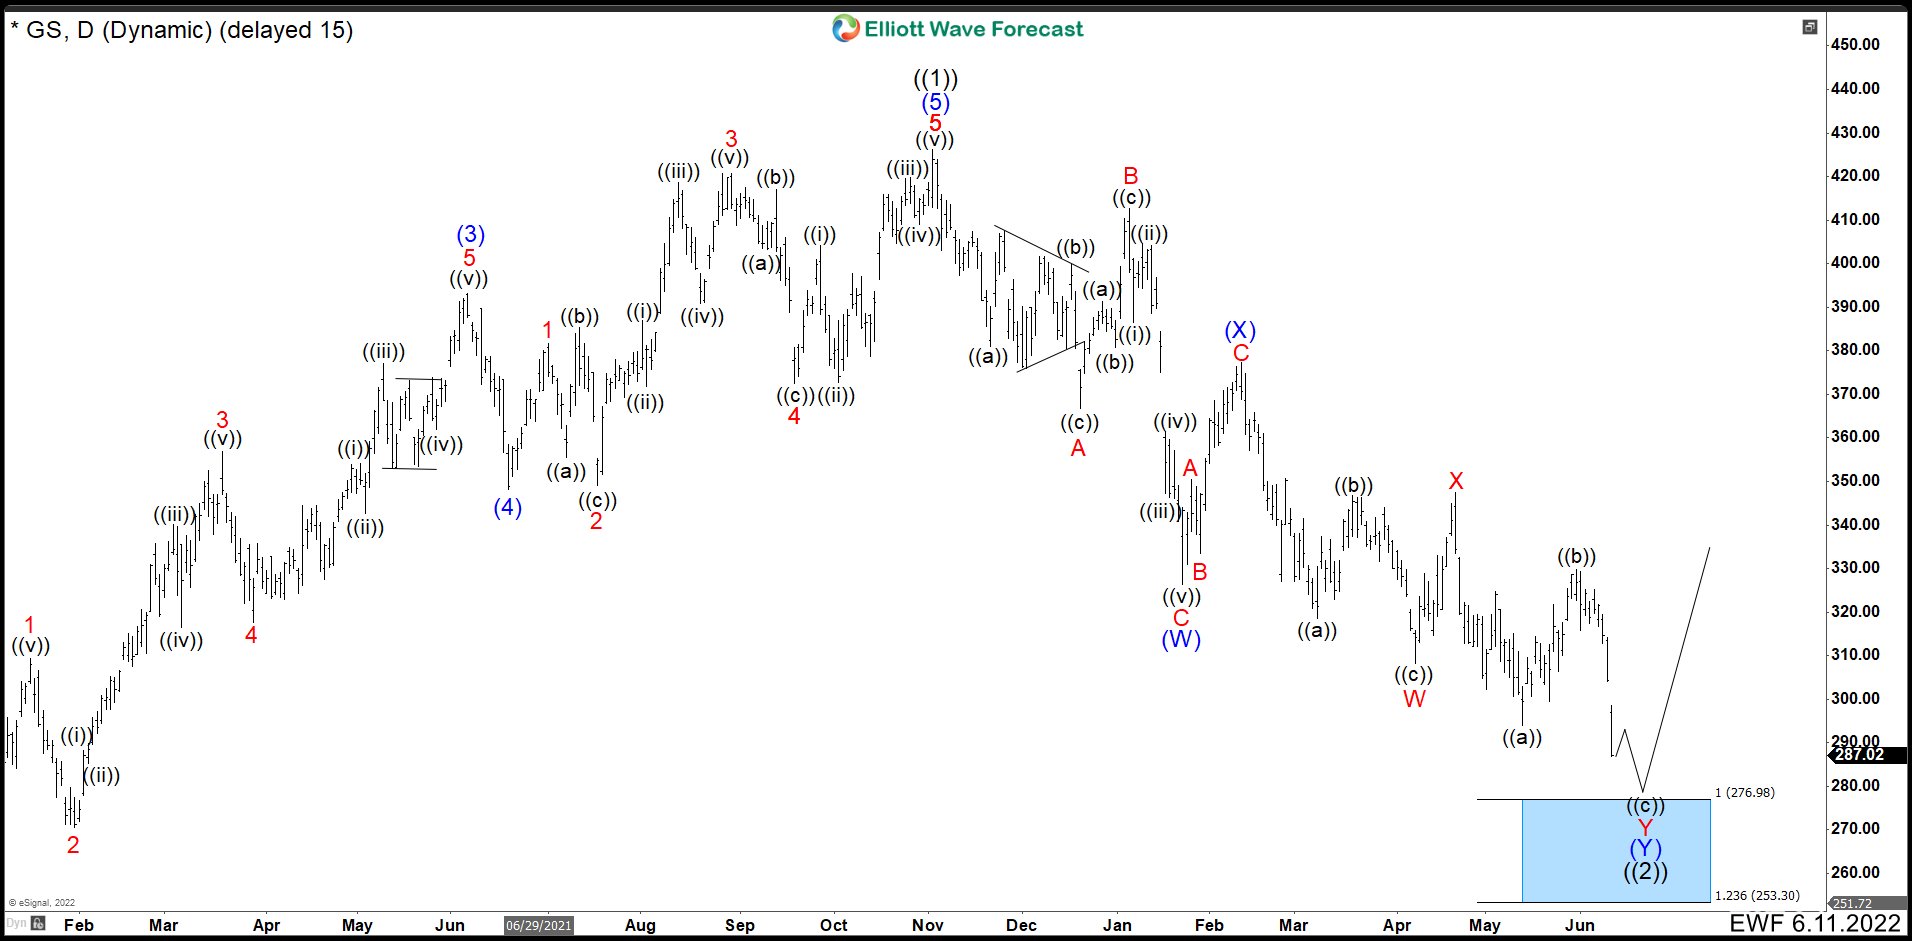
GS June Daily Chart
After 3 months, GS continued lower as expected, but it did not do an ABC correction. It is developing a WXY double correction as wave (Y). Down from wave (X), wave ((a)) ended at 318.49 and pullback as wave ((b)) finished at 347.04. Next drop as wave ((c)) ended at 307.87 and completed wave W. The connector rally to 50% Fibonacci retracement of wave W and wave X completed at 347.27. From this level we need 3 swings lower to finish wave Y of (Y). Wave ((a)) ended at 293.96 where we hit our target area in 305.00 – 277.00. Corrective bounce as wave ((b)) completed at 329.81 and we expect one more low as wave ((c)) to complete the whole correction as wave ((2)). Currently, we are looking to drop to 277.00 – 253.30 blue box and Goldman Sachs should start a rally.
Disclaimer: Futures, options, and over the counter foreign exchange products may involve substantial risk and may not be suitable for all investors. Leverage can work against you as well as for ...
more


