
Gold Weekly Forecast: Strong Finish To 2025 Keeps The Bull Case Alive

Image Source: Pixabay
The gold price ended last week on a steady footing, closing the year with an exceptional 65% return. After an aggressive rally in the previous few months, the precious metal pared some of its gains as traders took profits and reevaluated the interest rate outlook, inflation, and the US dollar. The pullback in gold prices stays within the broad uptrend.
The key driver behind gold’s resilience has remained the same for months, with the lowering of US interest rates. The US dollar closed the year with its sharpest annual decline in eight years, and this weakness kept gold prices well bid. Moreover, the softer US labor market data last week reinforced the narrative of the Fed easing through 2026. This holds real yields under pressure, maintaining gold’s traction as a non-yielding asset.
Meanwhile, the safe-haven demand for gold also remains intact amid ongoing geopolitical tensions in the Middle East, Russia, and particularly in the US. Central bank buying also provides a floor to the gold, making each dip a potential buying opportunity.
Looking ahead, the next week could be critical for near-term direction. Gold now needs a strong catalyst to resume its advance after the consolidation. If the incoming US data points to slower growth and easing inflation, the yellow metal could pick up momentum quickly. On the other hand, stronger-than-expected figures could trigger a deeper correction as expectations for rate cuts fade.
Volatility is expected to remain elevated as liquidity returns in full after the holidays. Traders will closely watch whether the dips continue to attract buyers or not. As long as the yellow metal holds above key levels, the price will remain constructive even if the path is uneven.
Key Events to Watch Next Week
- US ISM Manufacturing PMI (Monday)
- US ISM Services PMI (Tuesday)
- ADP Employment Report & JOLTS Job Openings (Wednesday)
- Weekly Jobless Claims (Thursday)
- US NFP (Friday)
- Prelim UoM Consumer Sentiment (Friday)
Gold Weekly Technical Forecast: Make or Break at 20-DMA
(Click on image to enlarge)
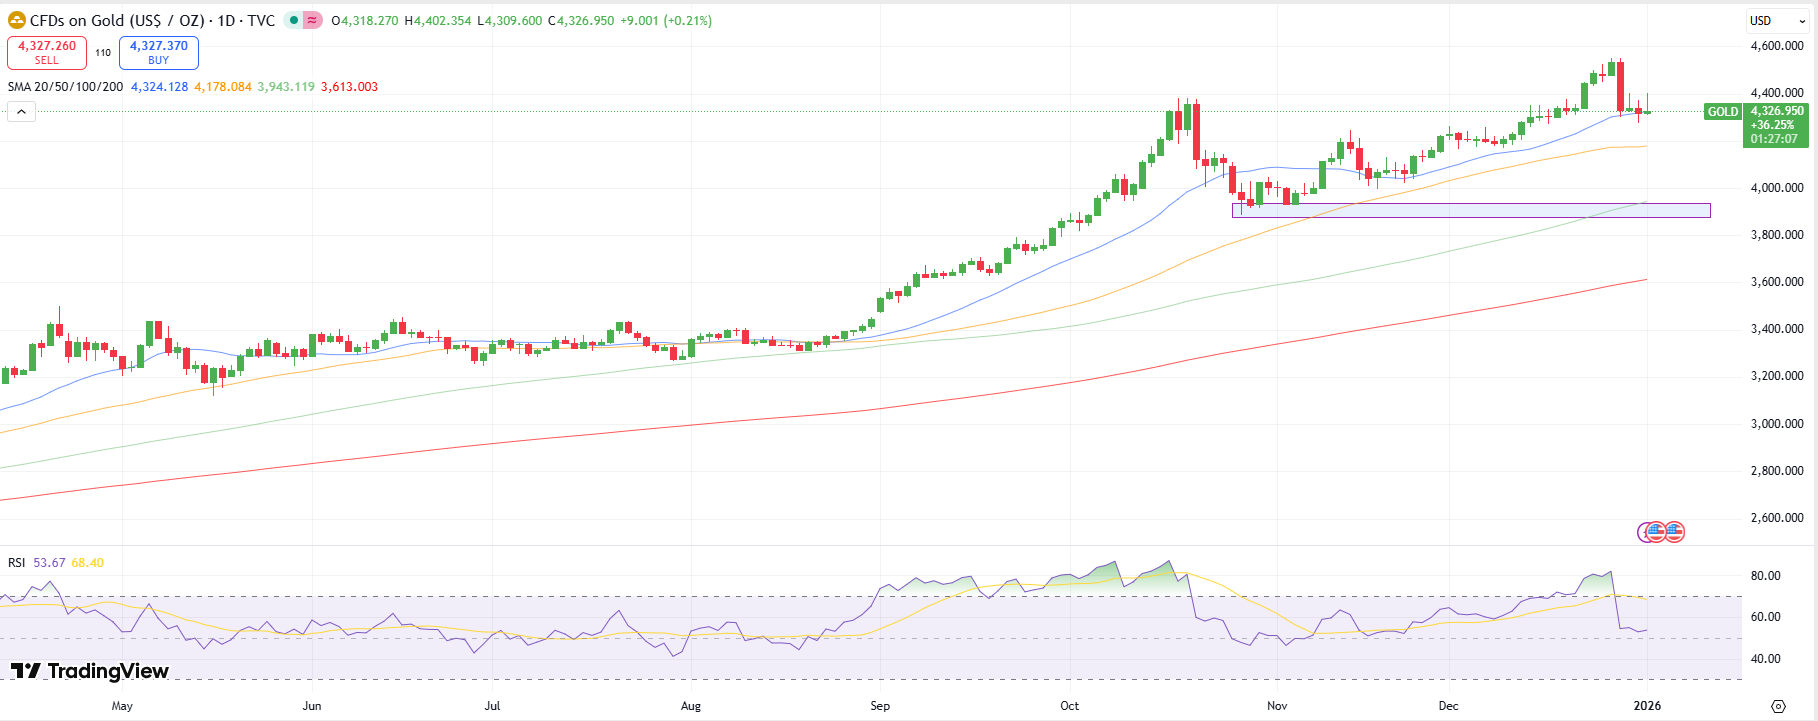
Gold daily chart
The daily chart for gold shows a strong bearish bias, as the price formed a bearish engulfing candle followed by bearish pinbars near the 20-day MA at the $4,315 mark. A sustained move below that level could push the price to the 50-day MA at $4,180, ahead of the confluence at the 100-day MA and the October lows at around $3,930.
On the other hand, moving above the 20-day MA could attract buyers and prompt a test of the $4,400 level ahead of all-time highs at the $4,550 mark. The RSI remains flat above 50.0, suggesting the potential of a consolidation before a breakout.
More By This Author:
GBP/USD Forecast: Bulls Aiming For 1.40 Amid Policy DivergenceAUD/USD Outlook Buoyed By Hawkish RBA Hold As Rate Hike Risks Re-Emerge
USD/CAD Outlook: Pressured As Soft US Inflation Weighs On The Dollar
Disclaimer: Foreign exchange (Forex) trading carries a high level of risk and may not be suitable for all investors. The risk grows as the leverage is higher. Investment objectives, risk ...
more

