Gold Stocks: Miners Teeter On The Edge Of Breakdown
I dedicated most of the technical part of yesterday’s analysis to mining stocks, arguing that their breakout above the declining resistance line was unlikely to last, and we didn’t have to wait long for the market to agree with that. The precious metals sector declined yesterday, and junior miners were the ones that plummeted the most. So much for miners’ short-term strength relative to gold.
As a brief reminder, here’s what I wrote yesterday:
The junior mining stocks closed the week above the declining medium-term support line, which might be viewed as something bullish. Let’s take a closer look.
(Click on image to enlarge)
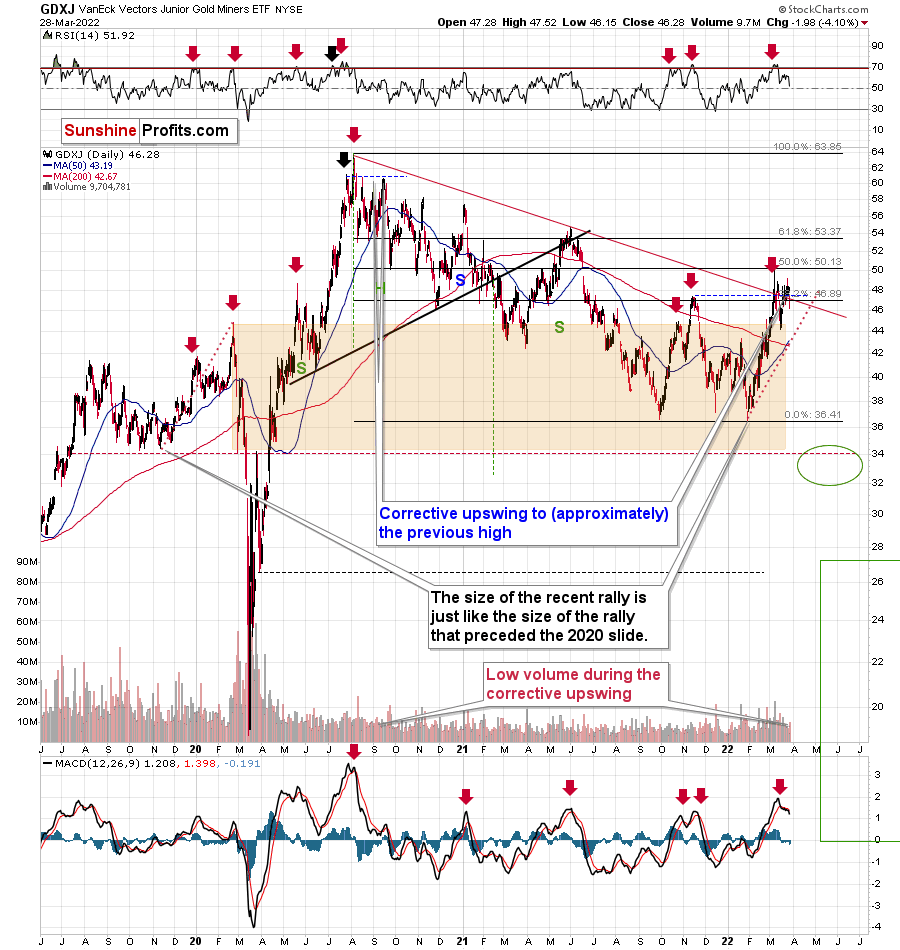
The GDXJ ETF closed the week above the declining red line and below the 38.2% Fibonacci retracement level. However, should one view this as really bullish?
Not really, as long as one remembers that not everything is about the price. The volume is also an important indicator as it shows, among other things, how much the market participants are really convinced that a given move is likely to take place. If the price moved higher on significant volume (but not excessively huge, as that could mean that the rally burnt itself out), it would mean that bulls won after a fierce fight.
Friday’s volume, however, was small. In fact, it was the lowest volume in the GDXJ ETF that we have seen this year. The second-lowest volume was recorded on Jan. 4, which was right before GDXJ’s decline.
So, should the breakout above the declining resistance be trusted? No, at least not yet.
This is especially the case given that the sell signal from the MACD indicator remains intact. These signals were highly effective at detecting major short-term tops. The fact that we just saw one indicates that the outlook for mining stocks is bearish.
The tiny-volume rally was immediately followed by a decline in volume that was not yet huge, but bigger than what we saw during the preceding rally.
Shouldn’t the volume be higher now? Not really. After the first crack in a dam (the breakdown), the water can leak at a small or moderate pace at first (a decline in average volume), but we all know what happens next. The water flow gains strength as the dam is destroyed. In the world of technical analysis, this could be viewed as a situation in which prices decline in a much more decisive way, with stronger volume, and more sharply so. Just like the dam is not going to stop the water, the previous support will no longer prevent declines, once the breakdown is confirmed.
The breakdown of junior miners hasn’t been confirmed yet. However, given the fact that it materialized while gold didn’t decline as much, and that it reversed before the end of the session (thus miners are weak relative to gold again), it seems that the breakdown will be confirmed shortly.
While the above analogy describes the move below the declining red resistance line visible on the previous chart, the below 4-hour chart features a breakdown below the rising short-term support line, and it also applies to it.
(Click on image to enlarge)
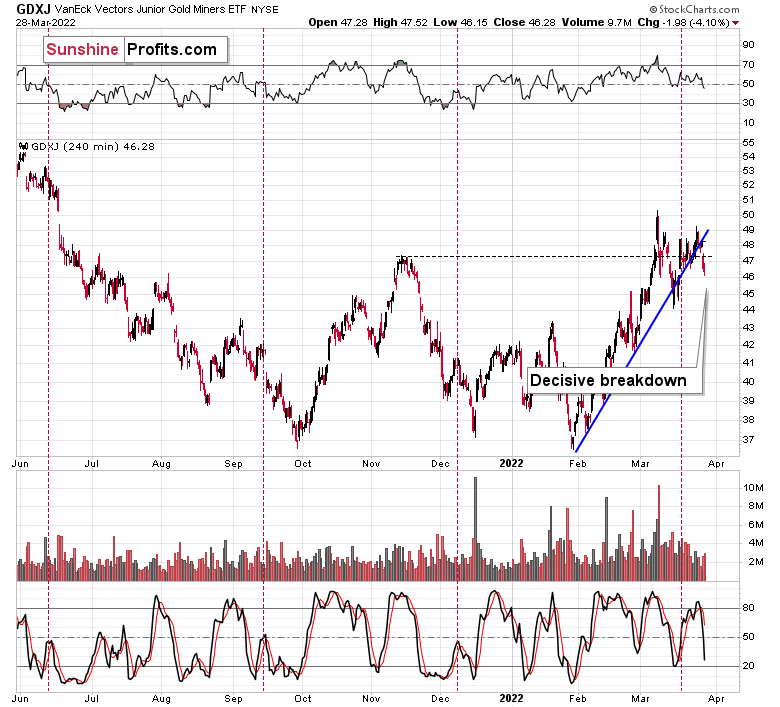
Yes, we did see this kind of breakdown in mid-March, and GDXJ rallied shortly thereafter. However, now the move is more decisive.
Back then, the closing price was very close to the support line, and now it’s clearly below that. Therefore, the breakdown is much more visible and, thus, reliable. Again, it’s not confirmed, but it’s likely to be so short.
Also, let’s check the scope of the miner’s underperformance. While the GDXJ was down by over 4% yesterday, gold…
(Click on image to enlarge)
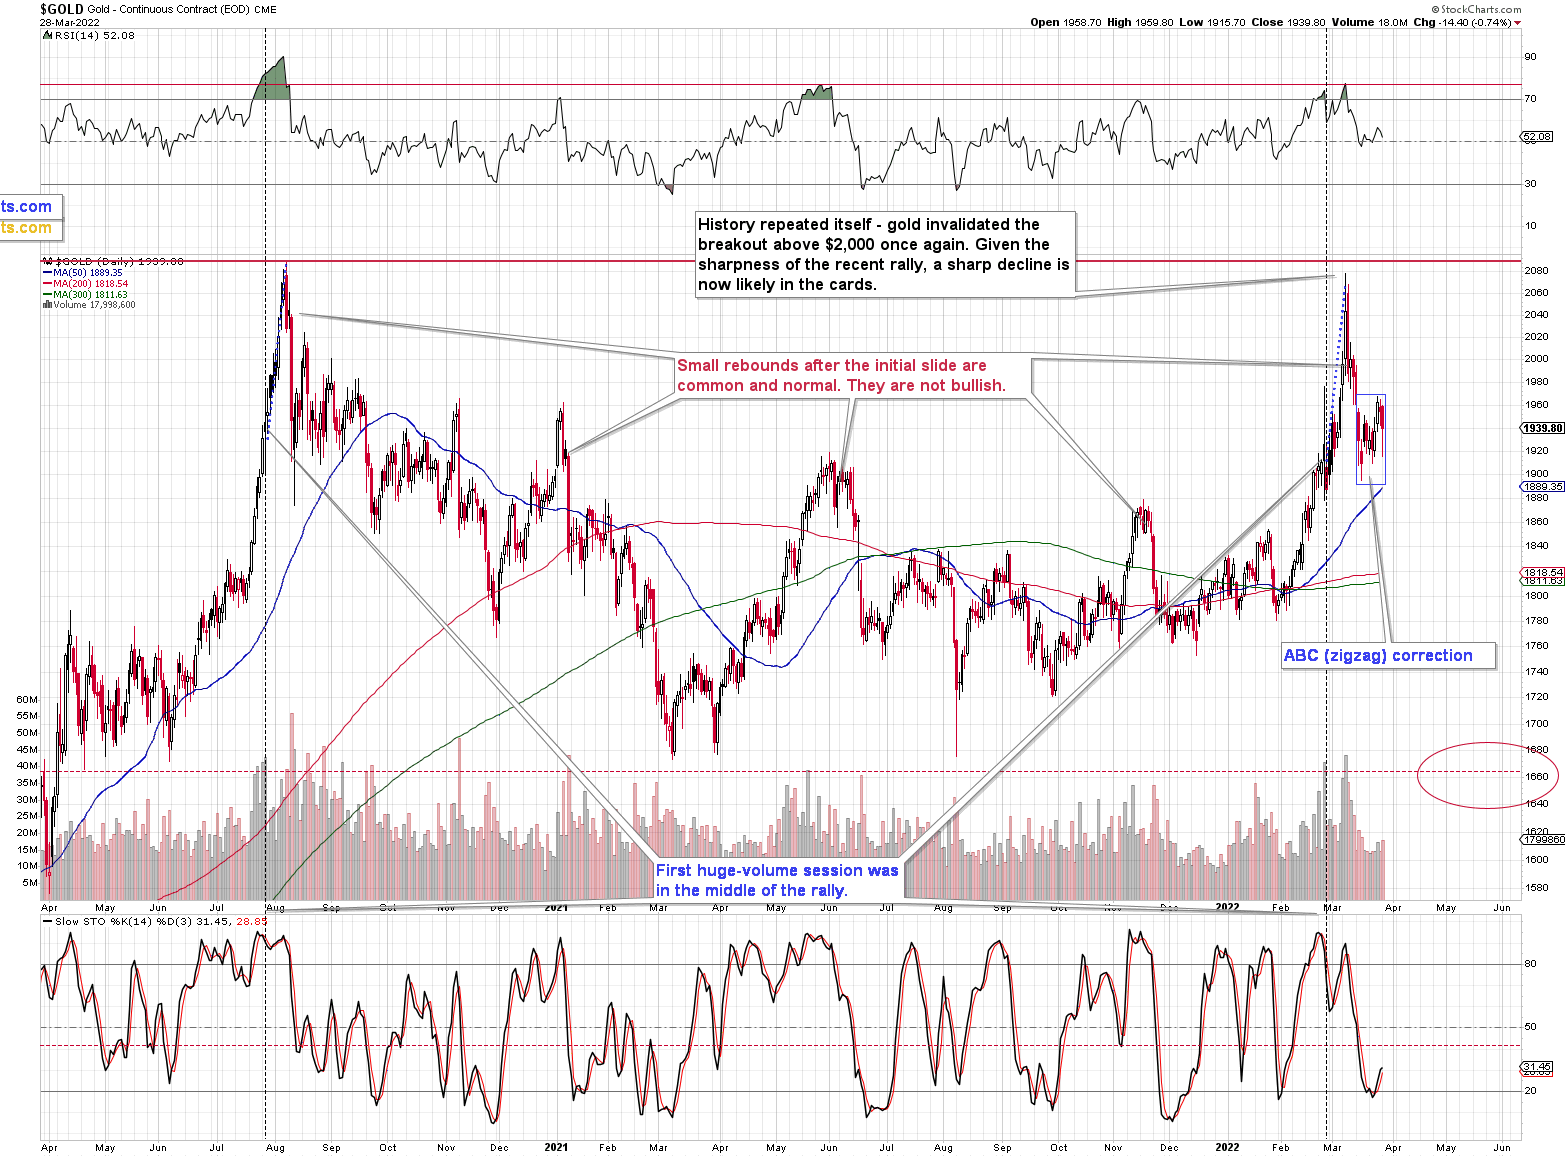
Gold was down by less than 1%. Miners are clearly underperforming the yellow metal here, which is common for the initial days of declines after short- and medium-term tops.
One might say that perhaps the decline in the junior miners was caused by a decline in the general stock market, but…
(Click on image to enlarge)
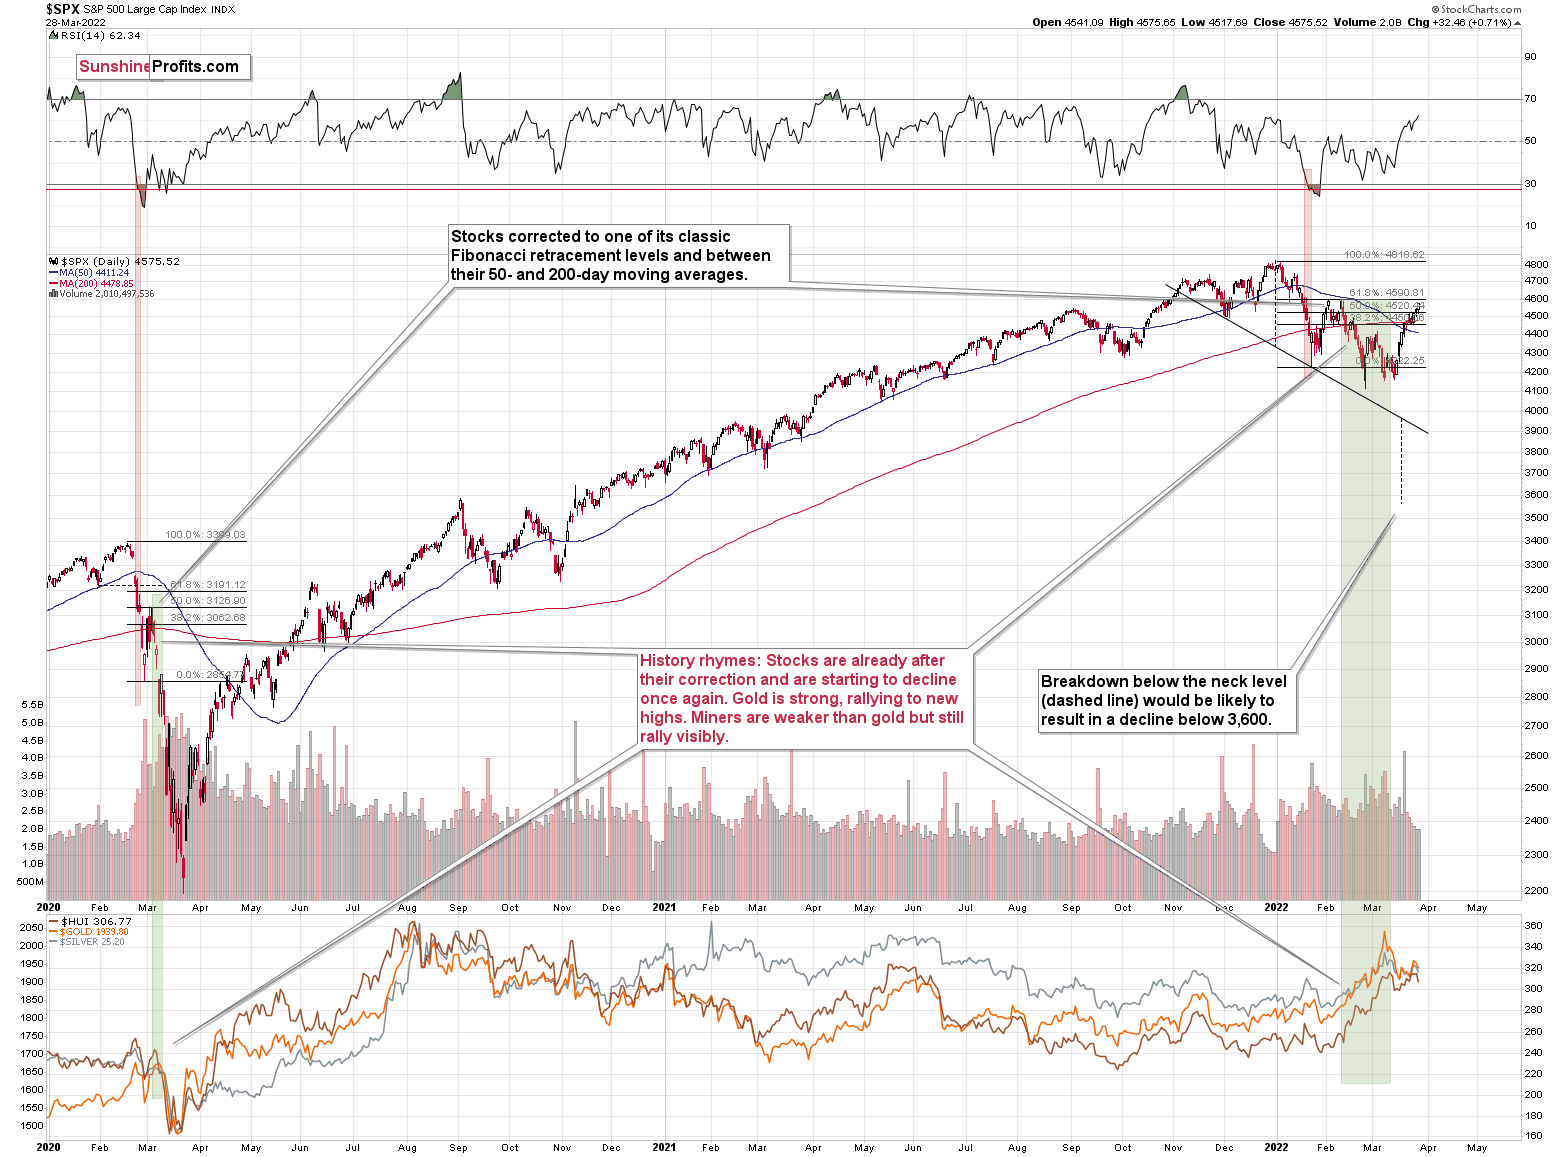
The general stock market didn’t decline yesterday. So, it wasn’t it. The most likely explanation of what we just saw is that miners are simply indicating that it’s about time to start the next (probably big) move lower.
Besides, the market had it coming, given the analogy to what happened in late-2012. I previously described it in the following way:
(Click on image to enlarge)
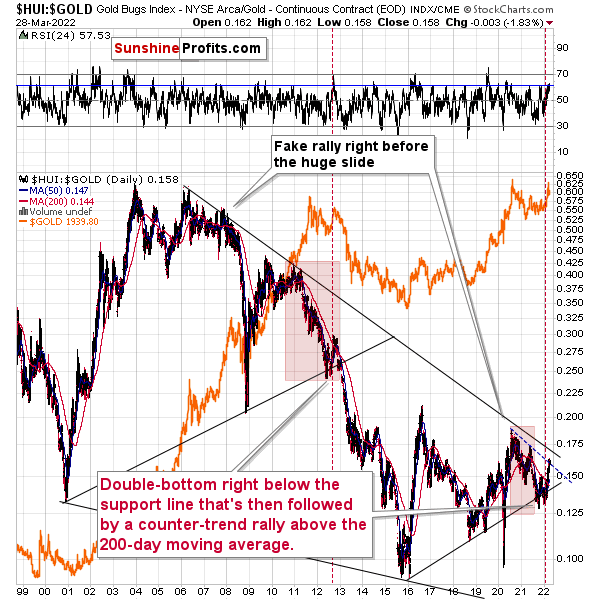
Gold stocks (GDX, GDXJ, and HUI Index) have recently been quite strong relative to gold. OK, but is this necessarily bullish? It could be, until one considers the fact that we saw the same thing at the 2012 top! This changes everything, and it does so, because the links between now and that top are almost everywhere: in gold, in silver, in gold stocks, and even in their ratios.
It is the gold stocks to gold ratio that I would like to start with today. That’s the flagship proxy for the relationship between these two markets.
As it turns out, the gold stocks to gold ratio is behaving almost identically as at the 2012 top in the precious metals sector.
In both cases, the ratio moved below the rising medium-term support line, then formed a double-bottom below the line, and invalidated the breakdown, which resulted in a counter-trend rally. The rally ended shortly after the ratio moved above its 200-day moving average (marked in red). That’s what happened recently. What happened next in 2012? The decline not only continued – it accelerated!
Consequently, the recent action in the ratio is not really bullish. In other words, the fact that gold stocks were recently (in the short run only) strong relative to gold doesn’t make the medium-term outlook for the precious metals sector bullish. However, it remains bearish.
Interestingly, the ratio itself moved to its declining resistance line, indicating that the corrective upswing might already be over or almost over. We get the same indication from the RSI indicator. It’s not above 70, but in the case of most local tops, the RSI didn’t have to move above 70. It just moved to more or less the same levels – I marked it with a horizontal blue line.
While yesterday’s weakness in miners didn’t trigger a huge decline in the HUI to gold ratio yet, the emphasis here is on “yet.” This means that more weakness is likely to follow. That’s very bearish for the mining stocks, especially junior miners that are likely to be affected to the greatest degree when the general stock market declines. The latter is likely too, in my view.
Not much changed in the USD Index yesterday, but that means that its bullish implications remain intact along with the bearish consequences for the precious metals sector, and so do my yesterday’s comments:
Let’s keep in mind that, based on the clearly confirmed breakout in the USD Index and a visible breather in it, the U.S. currency is likely to rally in the following days / weeks. This means that the precious metals sector is likely to get a bearish push shortly.
(Click on image to enlarge)
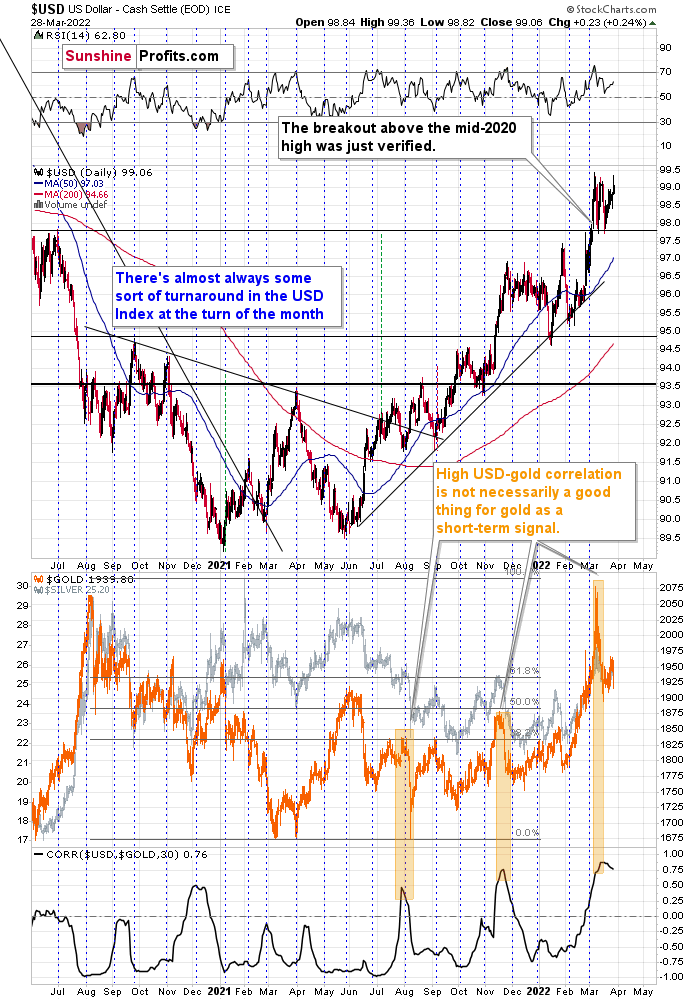
As the war-based premiums in gold and the USD appear to be waning, a high-interest-rate-driven rally in the USD is likely to trigger declines in gold. The correlation between these two assets has started to decline. When that happened during the last two cases (marked with orange), gold plummeted profoundly shortly thereafter.
All in all, technicals favor a decline in the precious metals sector sooner rather than later.
Disclaimer: All essays, research and information found on the Website represent the analyses and opinions of Mr. Radomski and Sunshine Profits' associates only. As such, it may prove wrong ...
more


