Gold Prices Retreat As Yields Rise, US Inflation And Powell Speech In Focus
Gold prices traded lower during Monday’s APAC session, as a rebound in the US Dollar and higher yields dampened the appeal of the yellow metal.

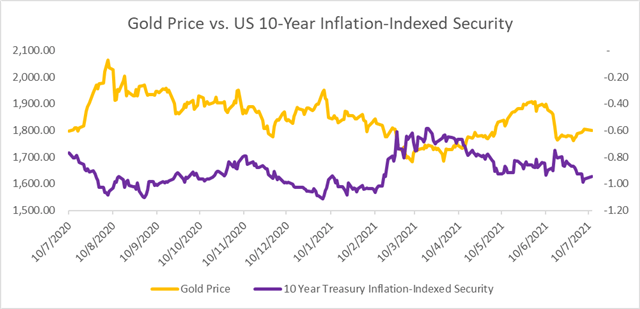
Real yields, as represented by the rate on 10-year inflation-indexed securities, climbed by 3bps to -0.94% from -0.97% seen on Friday, exerting downward pressure on bullion (chart below).
Recently, gold prices were buoyed by the emerging Delta variant of the Covid-19 virus that led to lockdowns and tightened travel restrictions around the world. This cast a shadow over the fragile and uneven economic recovery. Therefore, viral concerns may cause a delay in global central banks’ agenda to scale back asset purchases, buoying precious metal prices (GLD).
The People’s Bank of China (PBOC) unexpectedly cut the Reserve Requirement Ratio (RRR) for all banks by 50bps on Friday, releasing about 1 trillion Yuan of long-term liquidity into the economy. This aims to cushion “the impact of higher commodity prices on business production and operation”, reflecting slowing growth momentum in the world’s second-largest economy.
China is the first major economy that exited the pandemic-era stimulus, entering a period of strong economic recovery. The unexpected easing by its central bank warns about a bumpy road ahead for other countries if inflationary pressures and supply chain disruptions continue to squeeze manufacturers’ profit margins.
Looking ahead, traders are eyeing US core inflation and Fed Chair Jerome Powell’s semiannual Congressional testimony for clues about rising price levels and the Fed’s view on economic development. RBNZ and BoJ interest rate decisions will be closely eyed as well. Find out more from the DailyFX calendar.
Gold Price vs. 10-Year Real Yield

Source: Bloomberg, DailyFX
Gold Price Technical Analysis
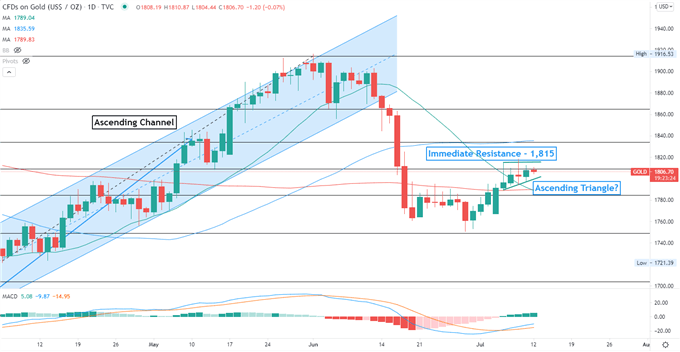
Technically, gold prices have likely formed an “Ascending Triangle” since last week, paving the way for further upside potential towards $1,815 -$1,830. An “Ascending Triangle” is a bullish continuation chart pattern that is formed by a horizontal line at the top and a rising trendline below it.
Immediate support and resistance levels can be found at around $$1,790 (100-day SMA) and $1,815 (ceiling of the “Ascending Triangle”) respectively. Near-term momentum appears to have tilted to the upside as the MACD oscillator is trending higher.
Gold Price – Daily Chart

Disclaimer: See the full disclosure for DailyFX here.


and now bonds go down.