Gold Prices On The Verge Of Breakdown Despite Risk Aversion
Gold prices were torn between conflicting cues at the start of the trading week as worries about political instability in Italy crushed risk appetite and sent the US Dollar higher alongside Treasury bonds, pushing yields lower. The greenback’s gains weighed on the anti-fiat yellow metal but the accompanying drop in yields spoke to its appeal as a non-interest-bearing alternative, capping losses.
Asia Pacific bourses celebrated after President Mattarella vetoed the nomination of a eurosceptic to lead the Economy Ministry but Europe was clearly of another mind. The spread between Italian and German bond yields – a measure of the extra risk in lending to Rome versus Berlin – jumped to a four-year high as regional markets came online, with the risk-off mood then spreading across the asset spectrum.
Crude oil edged lower early Monday as APAC markets took their turn pricing in Friday’s fireworks but market closures in the UK and the US cut off subsequent follow-through. That left the Brent and WTI benchmarks to linger in consolidation mode through the rest of the day. Tropical storm Alberto – the first of the season – had a seemingly negligible impact on oil infrastructure in the Gulf of Mexico.
COMMODITIES MAY EXTEND DROP IN RISK-OFF TRADE
Looking ahead, US consumer confidence data headlines an otherwise tepid data docket. A slight downtick is expected, which seems unlikely to alter Fed policy bets in a meaningful way. A speech from St. Louis Fed President James Bullard may likewise pass without fireworks. His dovish disposition is well-known and should not be surprising for financial markets.
This will probably put sentiment trends back at the forefront. Futures tracking the FTSE 100 and S&P 500 equities benchmarks are pointing lower before London and New York return online having been shuttered for holidays on Monday, hinting that a risk-off bias is set to prevail. That seems likely to bode ill for commodity prices as a whole.
GOLD TECHNICAL ANALYSIS
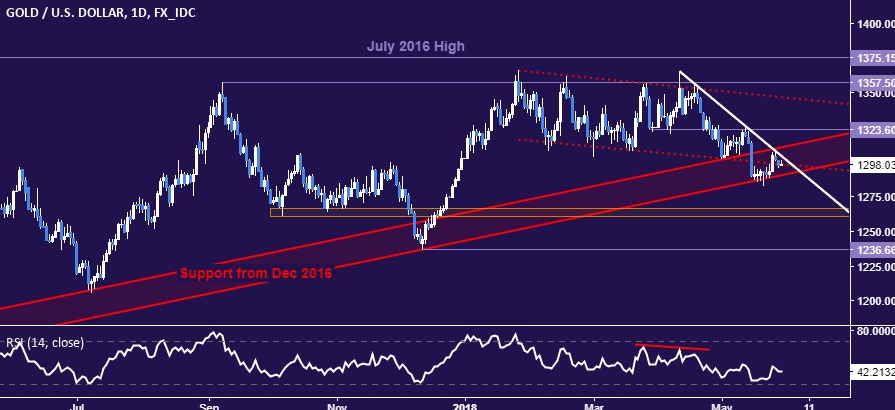
Gold prices edging back toward the lower bound of trend support guiding them higher since December 2016, now at 1290.05. A daily close below that initially targets the 1260.80-66.44 area. Alternatively, a break above falling trend line resistance at 1304.01 exposes trend support’s upper extremity at 1310.73, followed by a the inflection point at 1323.60.
(Click on image to enlarge)

CRUDE OIL TECHNICAL ANALYSIS
Crude oil prices are stalling at support in the 66.22-67.36 area having reversed downward as expected. A daily close through this barrier exposes a rising trend line at 65.38, followed by a chart inflection point at 63.96. Near-term resistance is marked by the April 19 highat 69.53.
(Click on image to enlarge)

Disclosure: Do you want to see how retail traders are currently trading the US Dollar? Check out our IG Client Sentiment ...
more


Why so sure there will be a breakdown?