
Gold Prices Near Highs As New US Tariff Threat Sinks Risk Appetite
Gold prices pared gains but still hovered near one-week highs on Tuesday with US trade policy as usual driving risk appetite.
Asia Pacific equity markets were crushed by news from the previous US session in which Donald Trump said that tariffs would be imposed on steel and aluminum imports from Brazil and Argentina in an unexpected move.
This apparent widening of trade conflict took a heavy toll, with resource-heavy Australian mainboard especially hard hit. Sentiment there was probably not helped by the Reserve Bank of Australia’s decision to leave interest rates on hold even though the callhad been widely expected.
In terms of predictable risk events the markets will now look with some trepidation to Australia’s official growth figures and a monetary policy decision from the Bank of Canada, both of which are due on Wednesday.
CRUDE OIL FIRM ON REPORT SAUDI PUSHING MORE PRODUCTION CUTS
Crude oil prices looked set for more gains on news from Reuters that Saudi Arabia was pushing for an extension to supply cuts.
The Organization of Petroleum Exporting Countries and others, a grouping known as ‘OPEC plus’ are discussing plans to increase the existing 1.2 million barrels per day reduction agreement by 400,00 barrels and extend its terms until June 2020. OPEC ministers will meet in Vienna on Thursday, with the expanded group convening on Friday.
Before that, on Wednesday, the market will get a look at weekly US energy inventory figures from the Department on Energy.
GOLD TECHNICAL ANALYSIS
Prices have been confined to a quite narrow range for the last four weeks on the weekly chart, with only $34 difference between the highest and lowest point.
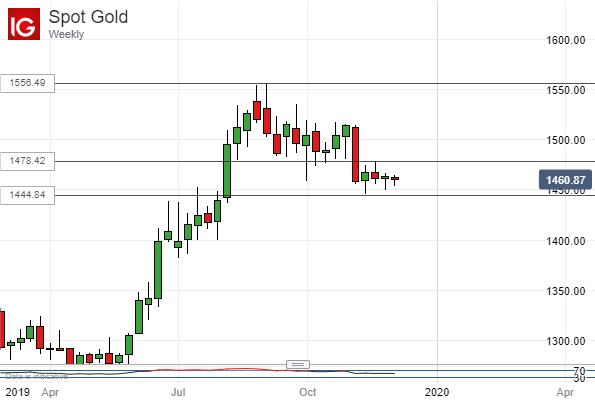
What’s more the width of that band would be narrower still were it not for the week of November 11’s intraday low which widened it considerably. The market looks indecisive as well it might, given the numerous uncertainties now facing risk appetite, from trade through to Brexit.
This indecision is likely to last at least another week or so but, absent any clear bullish impulse to claw back the falls of early November the bearish bias seems set to endure.
Crude Oil Technical Analysis
The US crude oil daily chart looks rather similar to the gold weekly. In this case however the lows of November 20 continue to limit bearish forays, as they did on November 29 too.
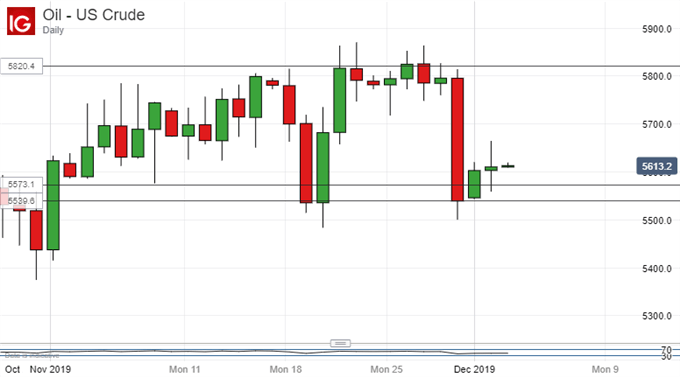
Just above them lies the second, 38.2% Fibonacci retracement of the rise up to November’s two-month highs from the lows of October. That comes in at $55.73/barrel and now firms near-term support.
While both hold, prices will retain scope to rise but substantive gains toward those highs may have to await the end of this week’s OPEC meet.


