
Gold Prices Eye 2019-High As Bull-Flag Formation Unfolds
Gold rebounds from a fresh monthly-low following the 1.2% contraction in U.S. Retail Sales and recent price action brings the 2019-high ($1326) on the radar as a bull-flag formation appears to be unfolding.
GOLD PRICES EYE 2019-HIGH AS BULL-FLAG FORMATION UNFOLDS

Developments coming out of the world’s largest economy may continue to heighten the appeal of bullion as Industrial Production unexpectedly contracts 0.6% in January, while the U. of Michigan Confidence survey shows 12-month inflation expectations narrowing to 2.5% from 2.7% per annum in January even though the gauge for household sentiment climbs to 95.5 from 91.2 during the same period.
In response, a growing number of Federal Reserve officials are likely to endorse a wait-and-see approach for monetary policy as Governor Lael Brainard argues that the central bank is ‘in a very good place to watch
and see that data as it comes in,’ and it seems as though the Federal Open Market Committee (FOMC) will continue to alter the forward-guidance for monetary policy as the permanent voting-member indicates that the ‘balance-sheet normalization process probably should come to an end later this year.’
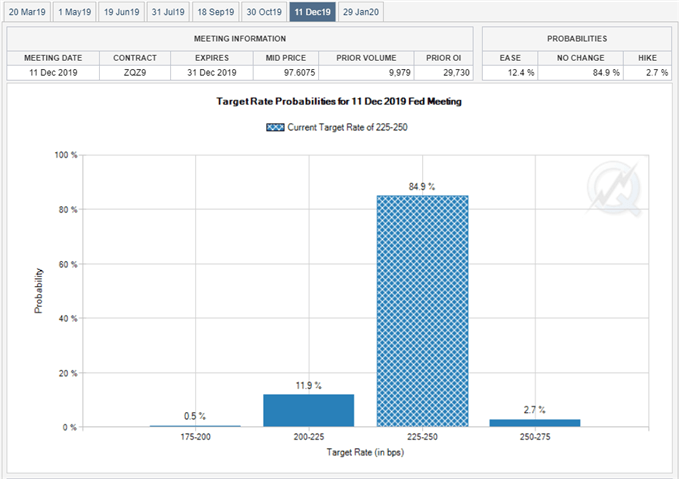
As a result, Fed Fund Futures may persistently show the FOMC on hold throughout 2019, and Chairman Jerome Powell & Co. may sound more cautious ahead of the next meeting in March amid the ‘cross-currents’ surrounding the economic outlook.
In turn, waning expectations for higher U.S. interest rates should continue to heighten the appeal of gold, and the precious metal may stage a larger advance over the coming days as a bull-flag formation appears to be panning out.
GOLD DAILY CHART
(Click on image to enlarge)
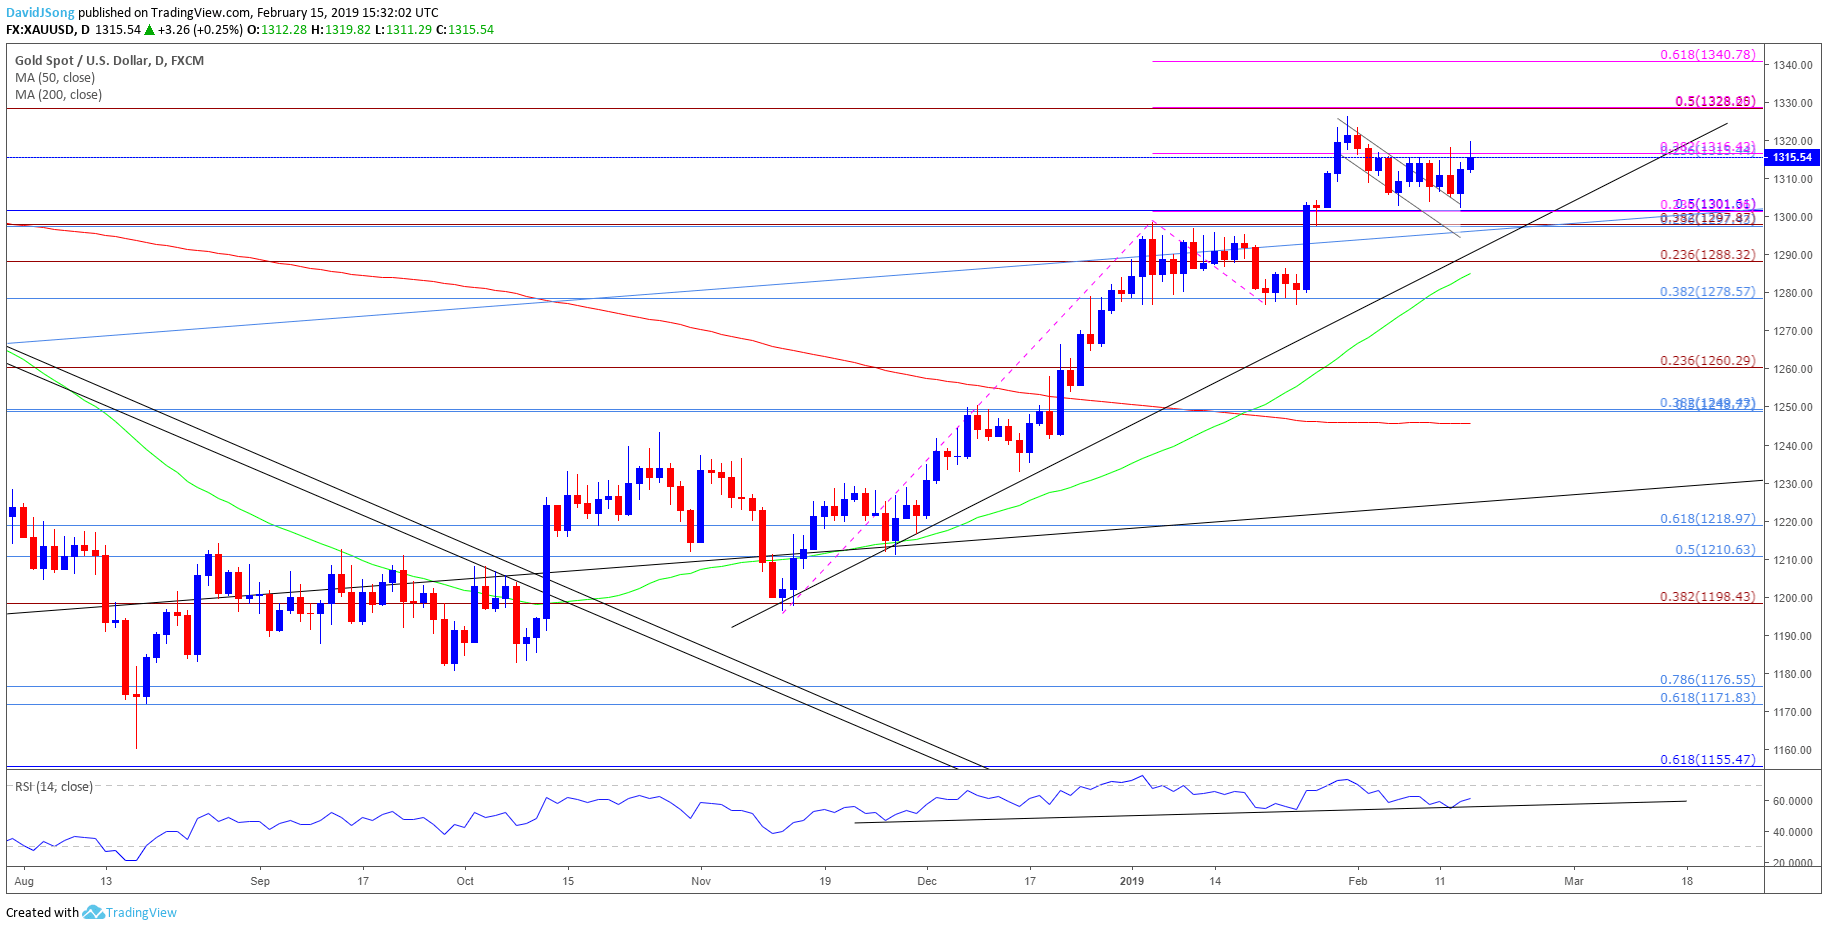
- The broader outlook for gold remains constructive as both price and the Relative Strength Index (RSI) track the bullish trends from late-2018, and a bull-flag formation appears to be unfolding as the former-resistance zone around $1298 (23.6% retracement) to $1302 (50% retracement) offers support.
- In turn, a close back above $1316 (23.6% retracement) raises the risk for a run at the 2019-high ($1326), but need a break/close above the $1328 (50% expansion) hurdle to bring the $1340 (61.8% expansion) region on the radar.


