
Gold Prices Close To Confirming Top, Crude Oil May Resume Descent
Gold prices tumbled as hopes for a breakthrough in the US-China trade war buoyed risk appetite and sent the US Dollar higher alongside Treasury bond yields. That sapped the appeal of the non-interest-bearing, anti-fiat yellow metal. Optimism was linked to supportive comments from US President Donald Trump.
Cycle-sensitive crude oil prices rose alongside stocks against the risk-on backdrop. They just managed to erase earlier losses however, finishing the day broadly flat. Selling pressure emerged earlier in the day on reports that Saudi Arabia is restoring output faster than expected after an attack mid-month.
ECB BULLETIN, DRAGHI COMMENTS, US GDP MAY SPOOK FINANCIAL MARKETS
Looking ahead, the ECB is back in focus. The central bank will publish its Monthly Economic Bulletin and President Mario Draghi is scheduled to speak. A downgrade of official growth estimates coupled with another dose of dovish rhetoric might stoke global slowdown fears.
The final set of second-quarter US GDP data is also due. It is expected to confirm that growth slowed to an annualized rate of 2 percent from 3.1 percent in the first three months of 2019. Upside surprises on US news-flow since the prior revision in late August may hint at a surprise upgrade.
Such a result might cool Fed rate cut prospects even as the ECB sounds the alarm on growth, sapping market-wide risk appetite. That threatens to punish sentiment-aligned crude oil prices. Gold might struggle to capitalize if worries about higher-than-desired rates are at the heart of liquidation.
GOLD TECHNICAL ANALYSIS
Rejection at immediate resistance seems to bring gold prices closer to confirming a Head and Shoulders (H&S) topping pattern. Confirmation of the setup on a daily close below 1480.00 implies a measured target near the $1400/oz figure, though sellers will need to overcome support in the 1437.70-52.95 area along the way. A daily close above 1535.03 targets 1563.00 next.
(Click on image to enlarge)
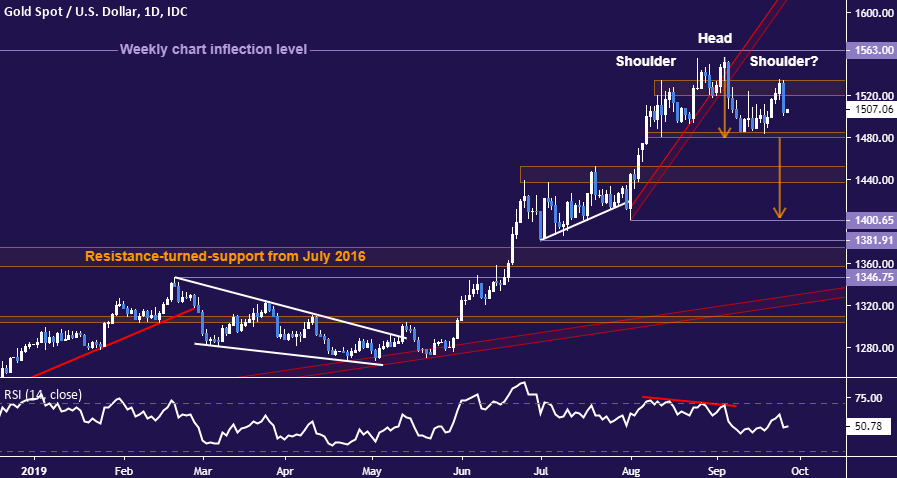
Gold price chart created using TradingView
CRUDE OIL TECHNICAL ANALYSIS
Crude oil prices are testing support guiding the move higher since early August. Breaking below this barrier – now at 55.04 – on a daily closing basis exposes support clustered around the $50/bbl figure. Alternatively, a bounce back above resistance at 58.76 and 60.84 targets September’s swing top just below $64/bbl.
(Click on image to enlarge)
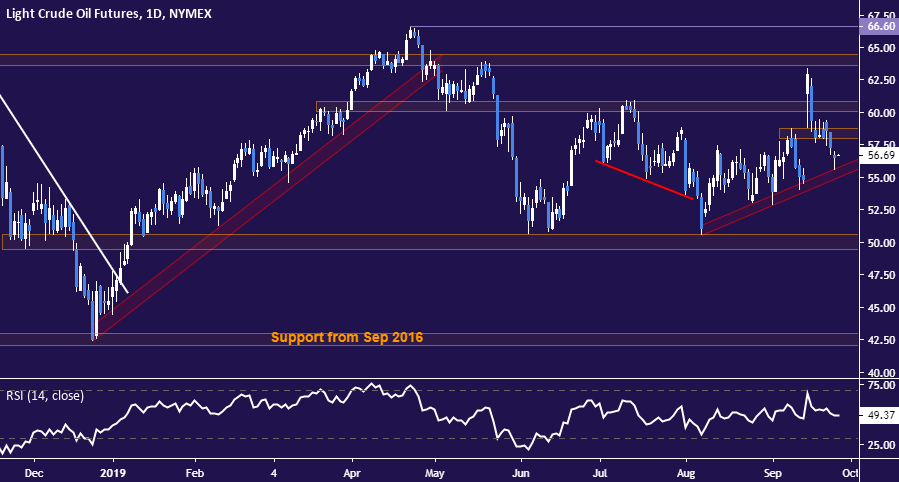
Crude oil price chart created using TradingView


